FXEM - EMPIRE MARKETS - Company New Article
To access the website's classic version and the new accounts, please click here
Nov 06, 2025
 |
|
|
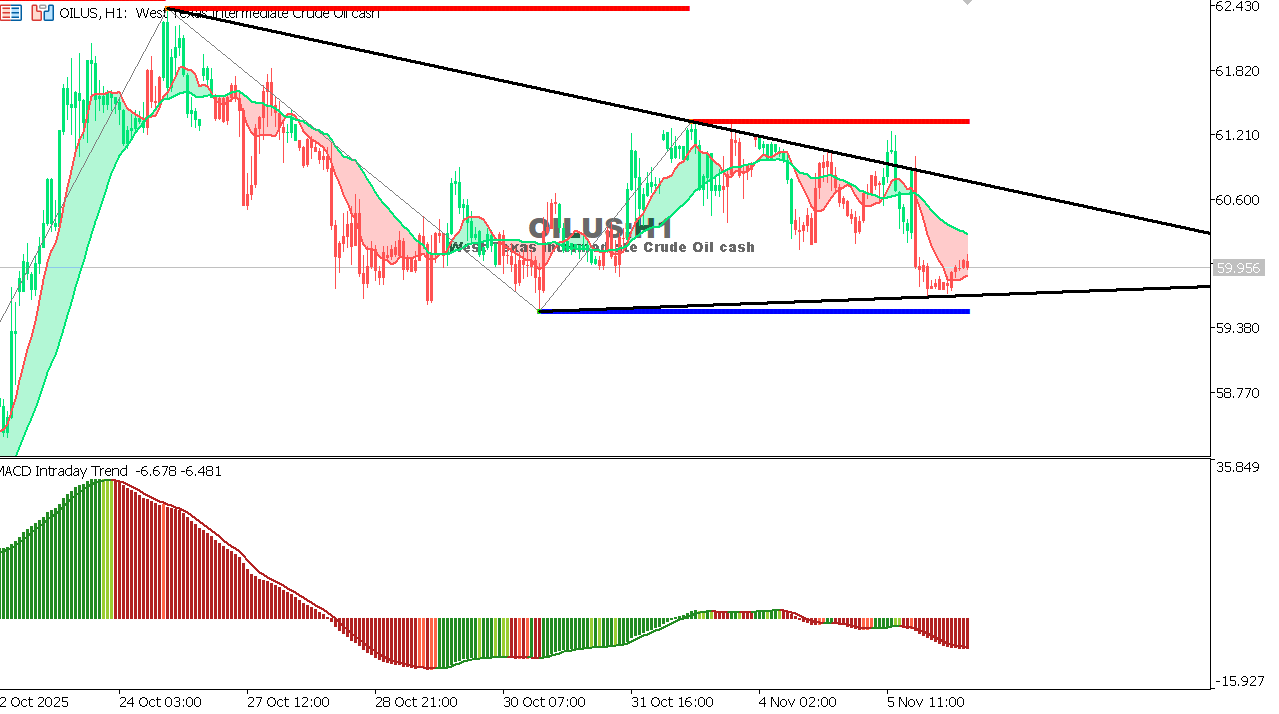 |
USOIL Chart on the hourtly time frameOverall Trend: Downward but attempting to establish a strong support base.
Reasons: Expectation:
|
 |
|
|
 |
|
|