FXEM - EMPIRE MARKETS - Company New Article
To access the website's classic version and the new accounts, please click here
Nov 05, 2025
 |
|
|
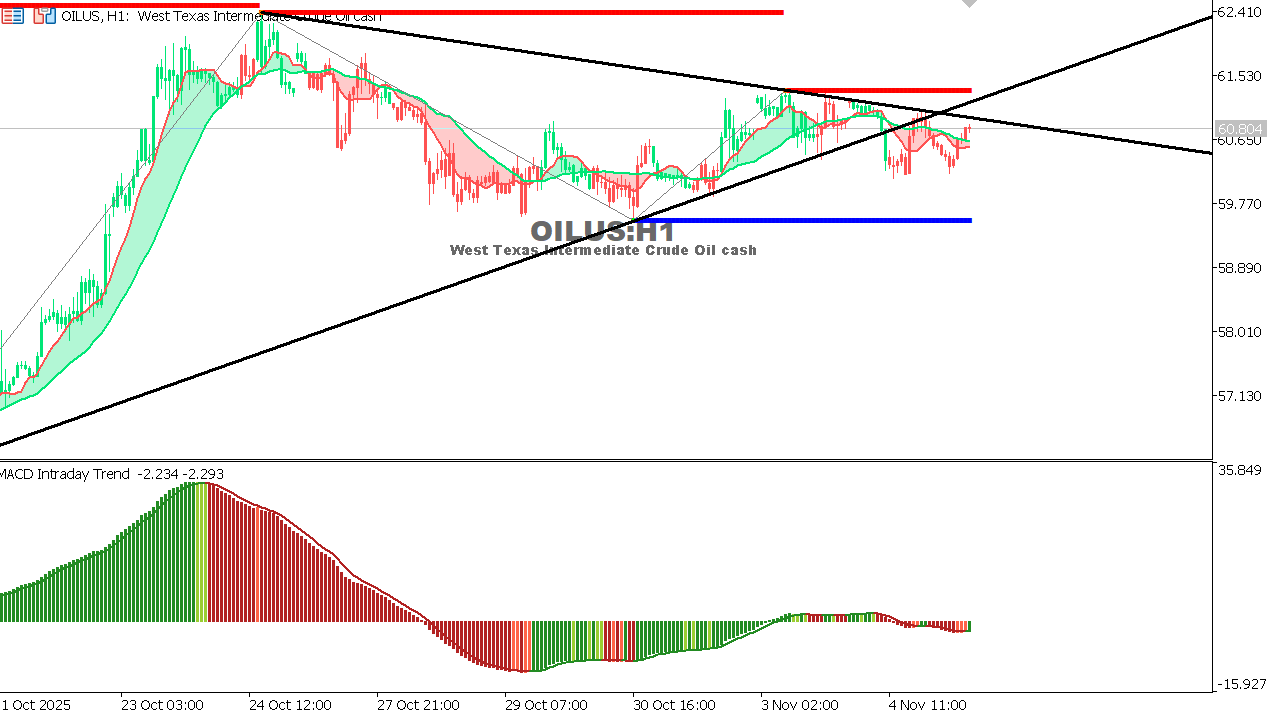 |
USOIL Chart on the hourtly time frameOil is priced at $60.80 per barrel after a significant decline. Technical indicators:
Reasons: Forecast: |
 |
|
|
 |
|
|