FXEM - EMPIRE MARKETS - Company New Article
To access the website's classic version and the new accounts, please click here
Nov 10, 2025
 |
|
|
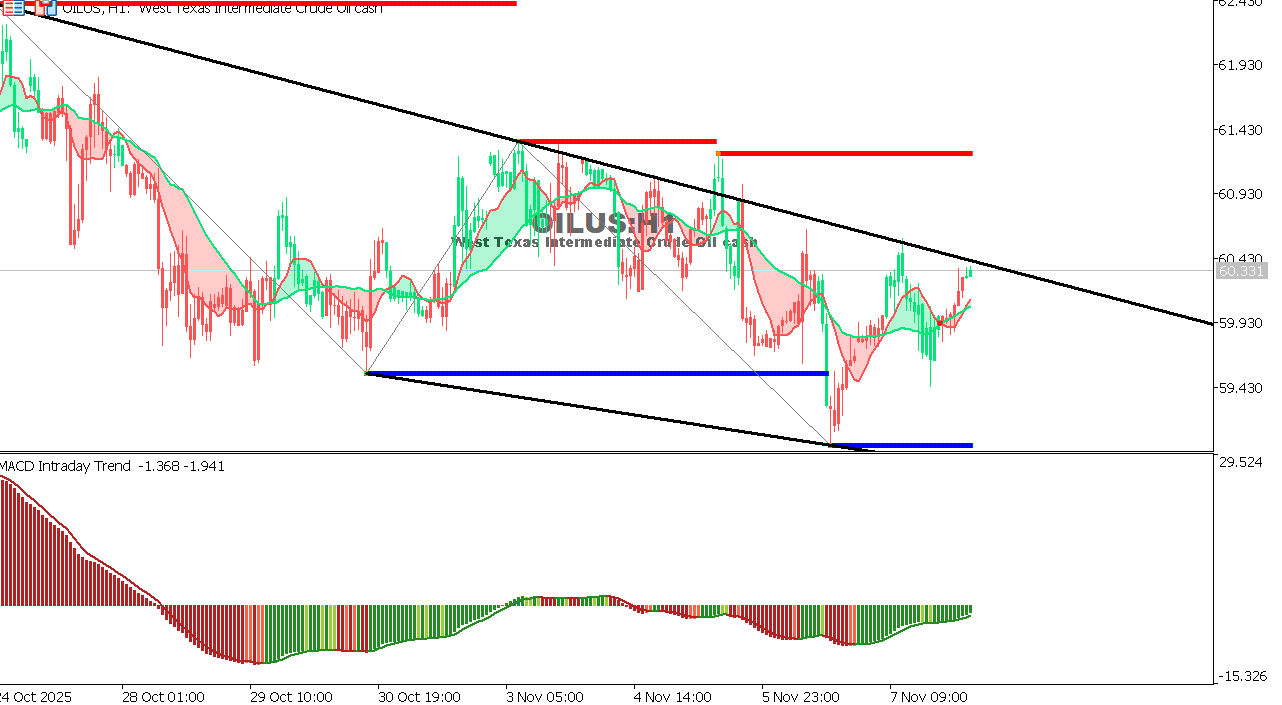 |
USOIL Chart on the hourtly time frameOil is trading near critical support levels after last week's declines, driven by market concerns about slowing global demand versus stable OPEC+ production. The overall trend remains bearish in the short term, with prices still under pressure from ample supply and rising US inventories.
Expectation: Sideways trading is expected to continue, with a limited corrective bounce possible if 61.20 is breached.
|
 |
|
|
 |
|
|