FXEM - EMPIRE MARKETS - Company New Article
To access the website's classic version and the new accounts, please click here
Sep 09, 2025
 |
|
|
 |
||
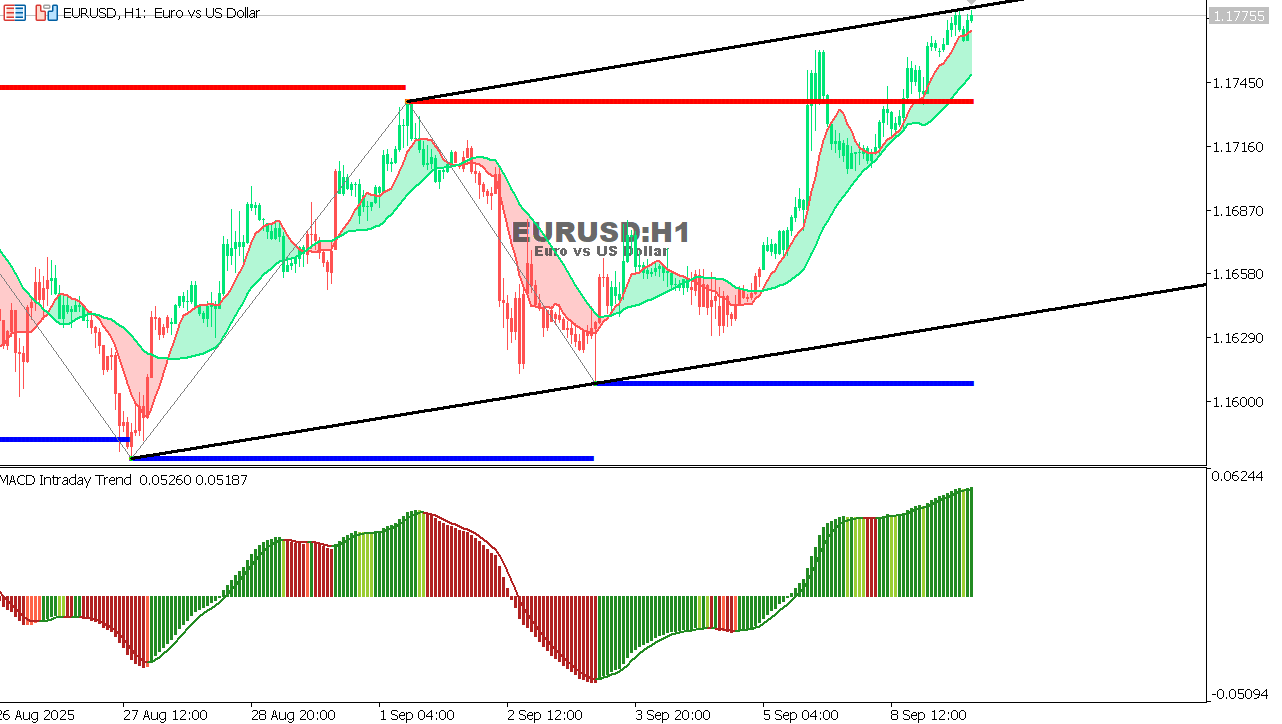
EUR/USD Chart on the hourtly time frame
Indicators:
Outlook: Bullish continuation likely as long as price stays above 1.1715. Clean breakout happening.
|
|
A review of the report from yesterday, dated September 8, 2025. |