FXEM - EMPIRE MARKETS - Company New Article
To access the website's classic version and the new accounts, please click here
Sep 08, 2025
 |
|
|
 |
||
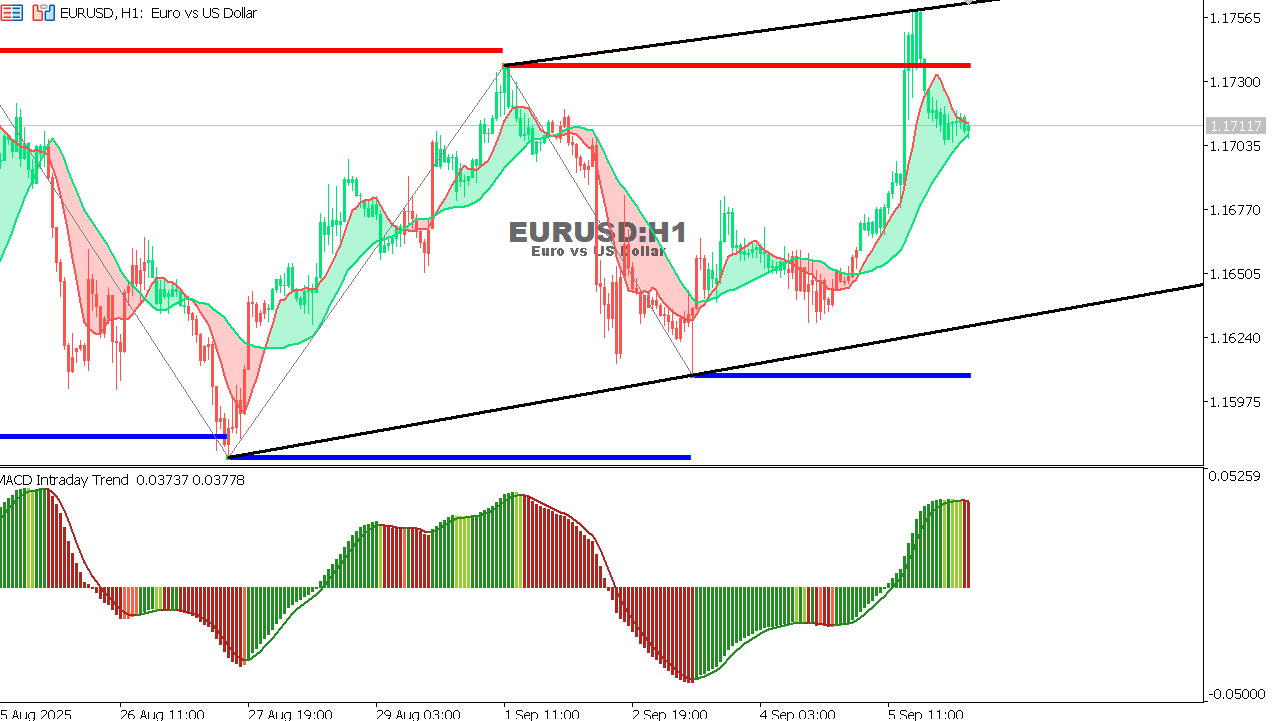
EUR/USD Chart on the hourtly time frame
|
|
- An overview of last week's report dated September 4, 2025. |