FXEM - EMPIRE MARKETS - Company New Article
To access the website's classic version and the new accounts, please click here
Aug 27, 2025
 |
|
|
 |
||
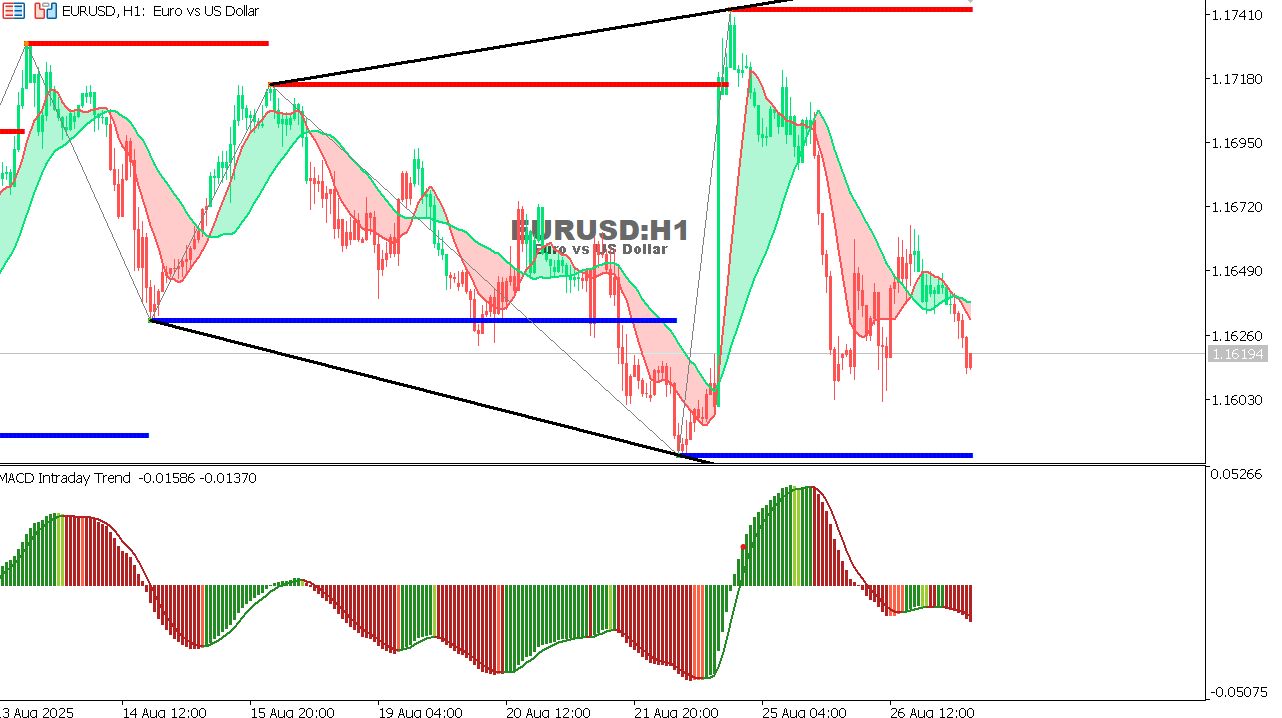
EUR/USD Chart on the hourtly time frameOverall Trend: Bearish in the short term. Price Action: Broke a symmetrical triangle to the downside and is trading below previous support. Support: 1.1600 (very strong). Resistance: 1.1650 – 1.1700. MACD: Negative with weak momentum, suggesting further downside. Outlook: Likely to continue downward toward 1.1600 unless price reclaims 1.1650.
|