FXEM - EMPIRE MARKETS - Company New Article
To access the website's classic version and the new accounts, please click here
Feb 19, 2026
 |
|
|
 |
|
|
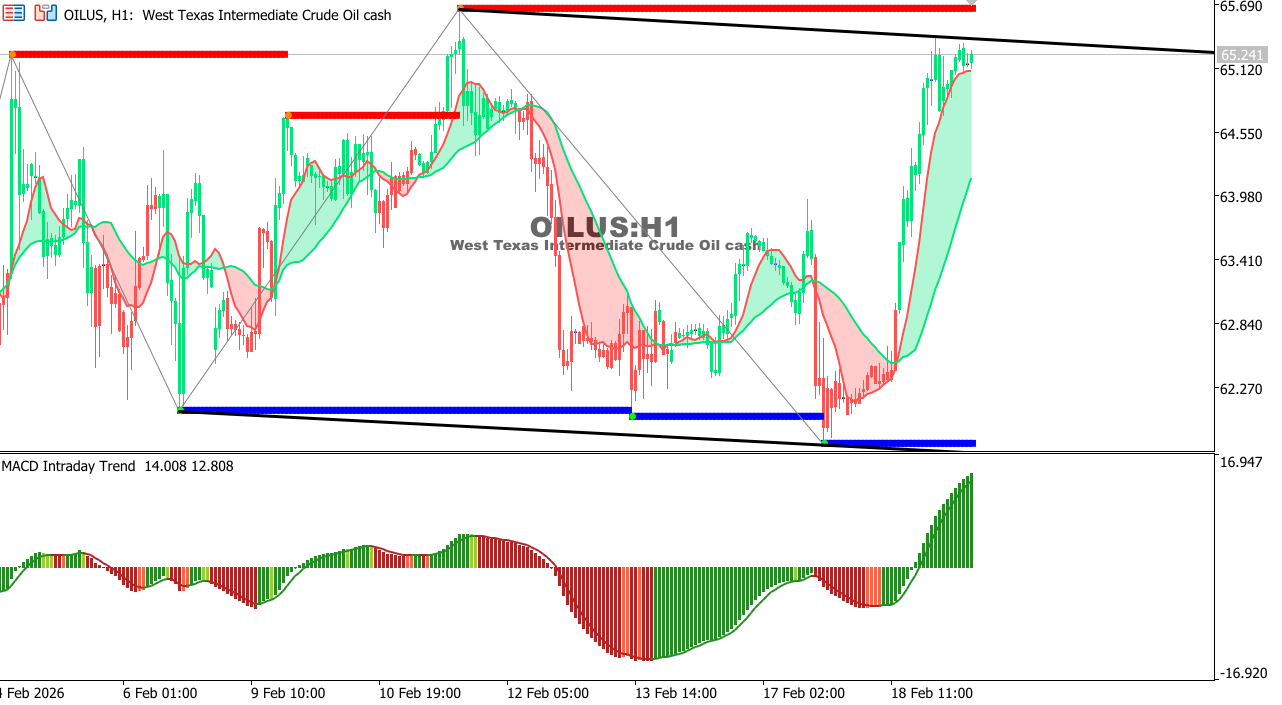 |
USOIL Chart on the hourly time frameOil is trading within a short-term descending channel but is attempting to form a higher low than the previous one, indicating attempts to stabilize after recent selling pressure. The MACD indicator shows a decrease in negative momentum, which could pave the way for a corrective bounce. General Trend: Bearish with attempts at correction Expectation: Holding above 64.40 supports a bounce towards 66.10, while a break below support could bring renewed pressure towards 63.70.
|
 |
|
|
 |
|
|