FXEM - EMPIRE MARKETS - Company New Article
To access the website's classic version and the new accounts, please click here
Feb 18, 2026
 |
|
|
 |
|
|
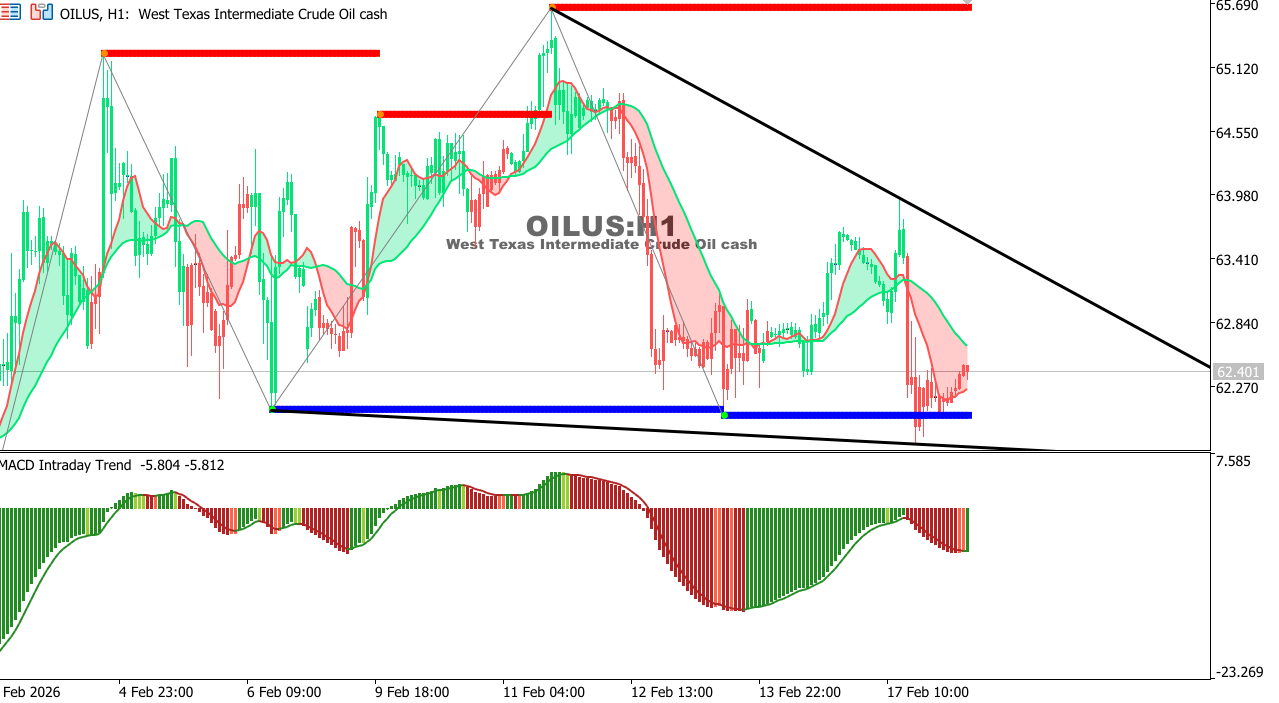 |
USOIL Chart on the hourly time frameOil remains within a sideways-to-bearish range, trading near 62.40 amid a lack of strong catalysts. Staying below 63.50 keeps downside risks intact. Overall Trend: Sideways to bearish Outlook: Range-bound trading likely; a break below 61.80 may trigger further downside.
|
 |
|
|
 |
|
|