FXEM - EMPIRE MARKETS - Company New Article
To access the website's classic version and the new accounts, please click here
Feb 20, 2026
 |
|
|
 |
|
|
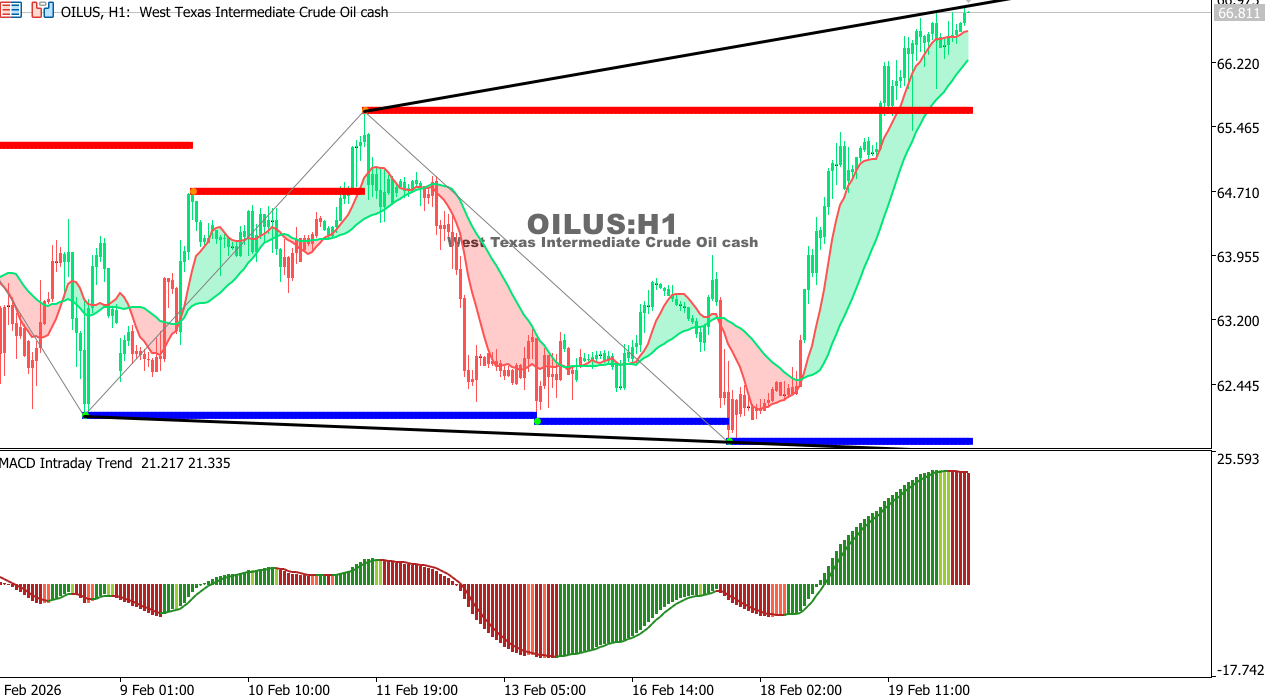 |
USOIL Chart on the hourly time frameOil is moving within a sideways range with a downward bias after failing to hold above 68.00. Momentum remains weak, and the MACD indicator is hovering near negative territory. A break below 66.00 would reinforce the decline towards 64.80, while a break above 68.20 would turn the short-term outlook positive. General Trend: Neutral with a slight downward bias Expectation: Continued volatility with limited downward pressure.
|
 |
|
|
 |
|
|