FXEM - EMPIRE MARKETS - Company New Article
To access the website's classic version and the new accounts, please click here
Mar 05, 2026
 |
|
|
 |
||
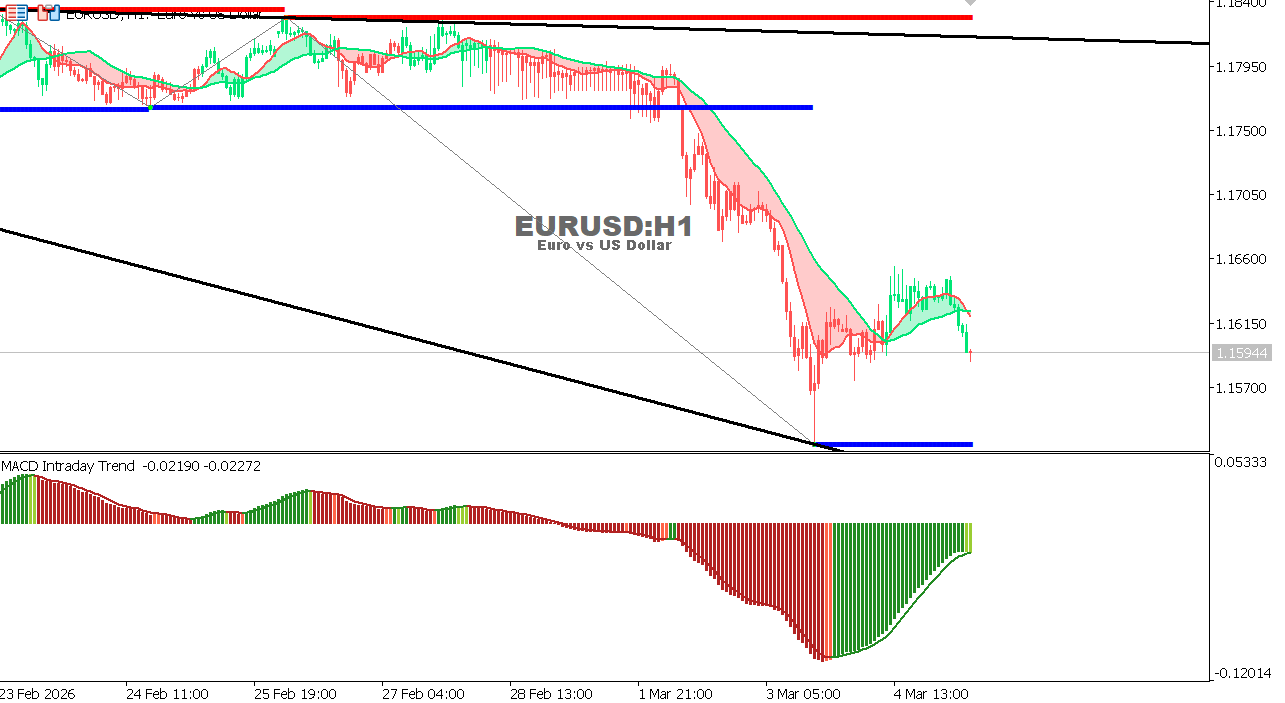
EUR/USD Chart on the hourtly time frameThe pair remains under selling pressure after breaking the key support area near 1.1750 and is currently trading around 1.1590 within a clear downward trend. The recent rebound appears to be only a technical correction, as the price is still trading below short-term averages. The MACD indicator shows a slight improvement in momentum but remains in negative territory, suggesting that the bearish trend is still dominant in the short term. Overall Trend: Bearish Outlook:
|