FXEM - EMPIRE MARKETS - Company New Article
To access the website's classic version and the new accounts, please click here
Mar 04, 2026
 |
|
|
 |
|
|
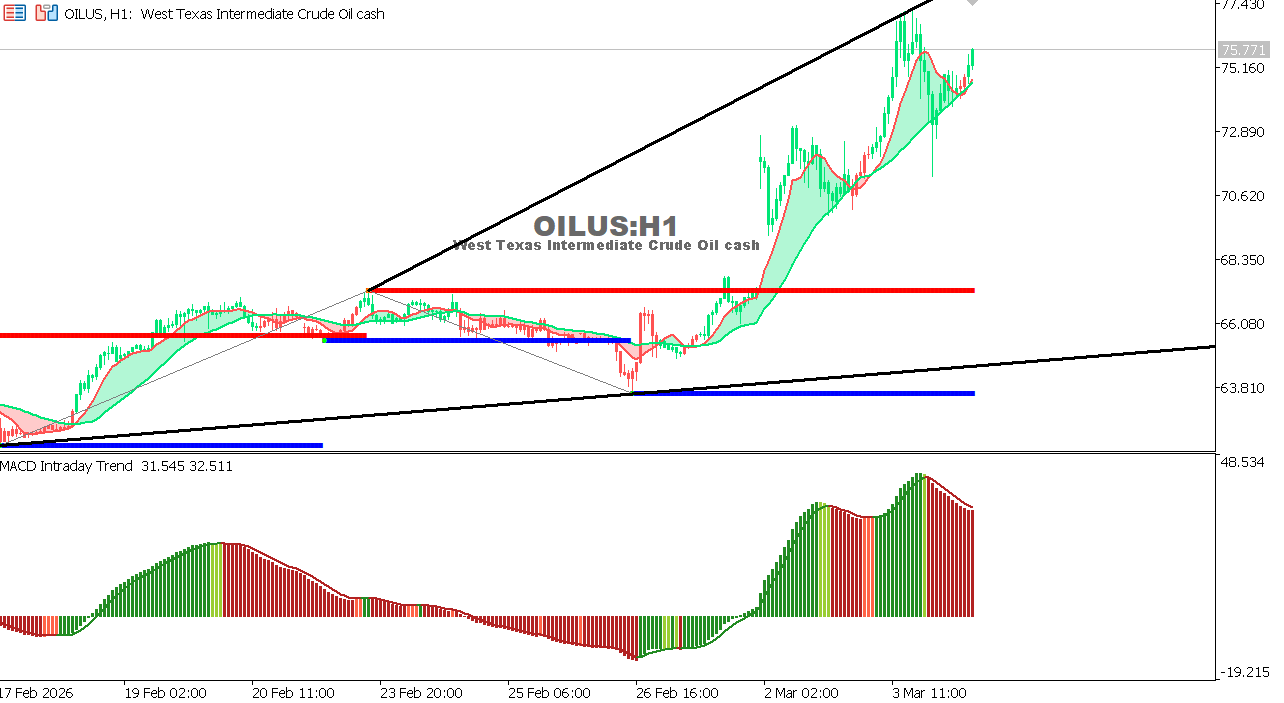 |
USOIL Chart on the hourly time frameOil continues to trade near elevated levels due to fears of supply disruptions in the Gulf region. Momentum remains relatively positive despite some temporary easing. Overall Trend: Bullish Outlook: Ongoing tensions support further gains, while any political de-escalation could trigger quick profit-taking.
|
 |
|
|
 |
|
|