FXEM - EMPIRE MARKETS - Company New Article
To access the website's classic version and the new accounts, please click here
Mar 05, 2026
 |
|
|
 |
|
|
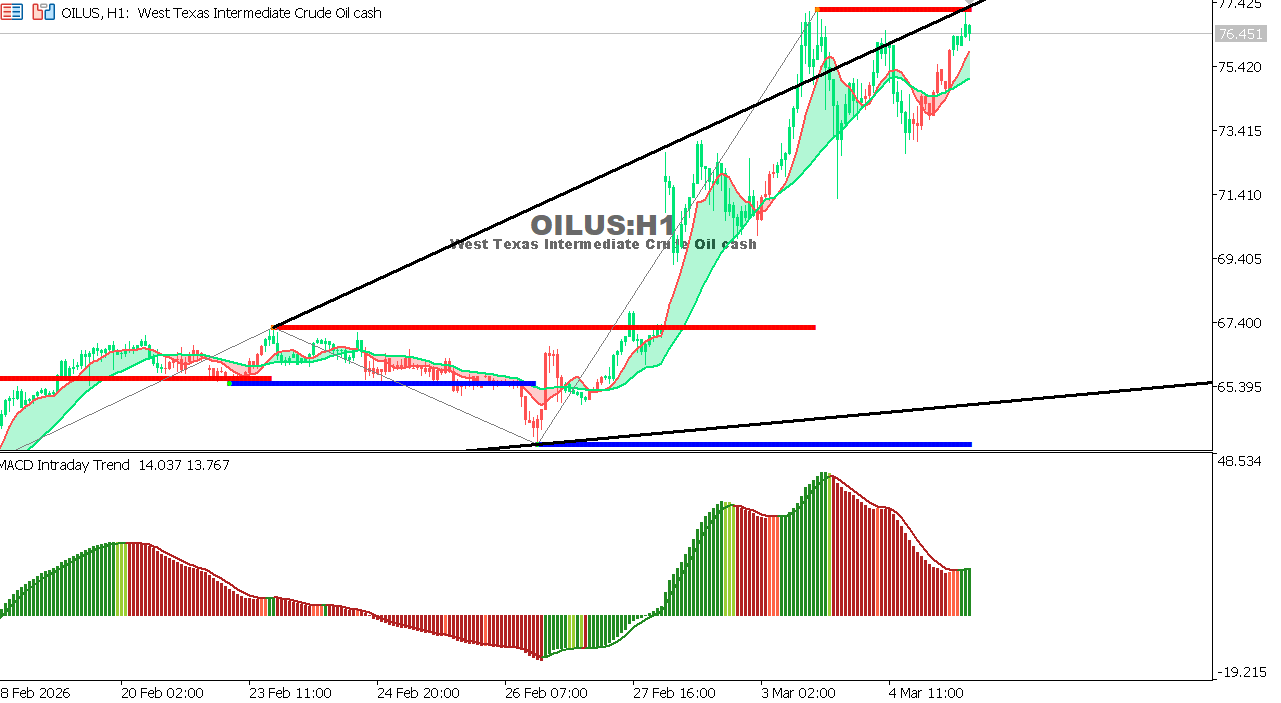 |
USOIL Chart on the hourly time frameOil is trading near 76.45 after a gradual recovery from recent lows, supported by improving demand expectations and supply concerns. Bullish momentum remains present, although it has started to slow slightly. Overall Trend: Moderately bullish Outlook:
|
 |
|
|
 |
|
|