FXEM - EMPIRE MARKETS - Company New Article
To access the website's classic version and the new accounts, please click here
Dec 12, 2025
 |
|
|
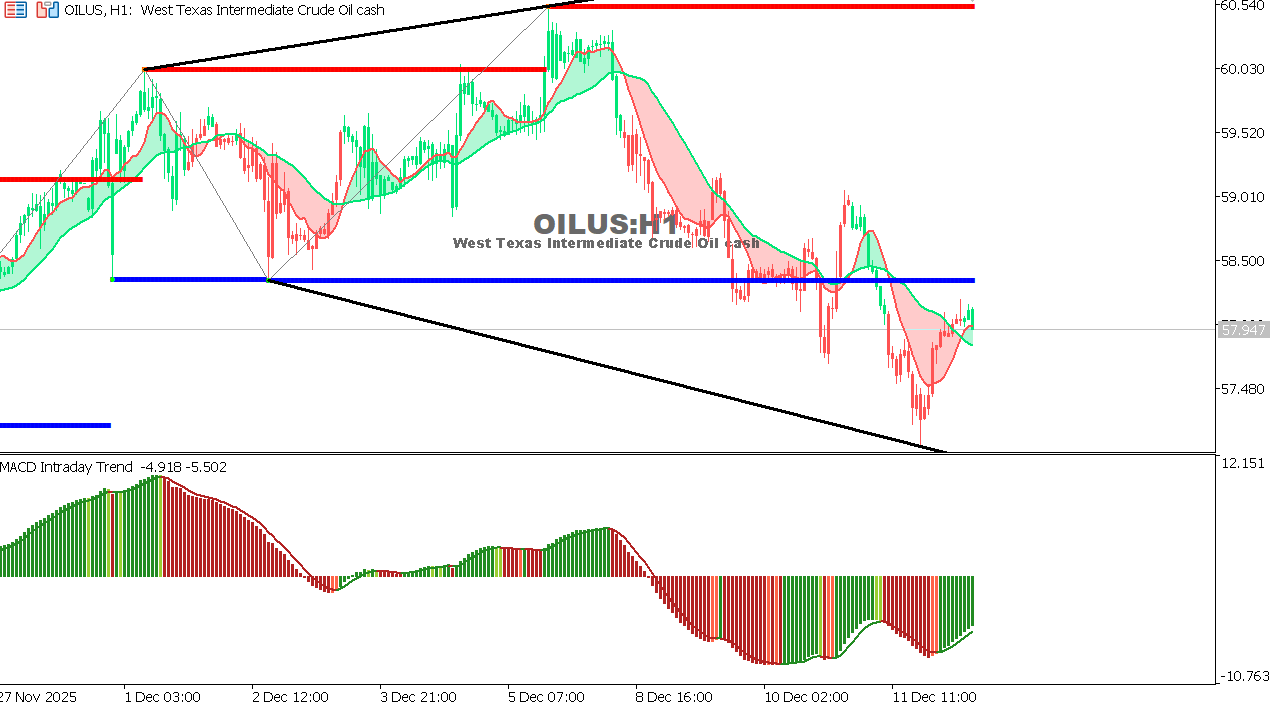 |
USOIL Chart on the hourly time frameOil prices improved, supported by optimism about increased winter demand and continued expectations of supply cuts. However, the movement remains within a wide sideways range, making breakouts crucial for market stability. General Trend: Neutral with a slight upward bias Expectation: A break above 58.60 could open the way towards 60.00, while a break below 56.80 would bring renewed pressure towards 55.90. |
 |
|
|
 |
|
|