FXEM - EMPIRE MARKETS - Company New Article
To access the website's classic version and the new accounts, please click here
Dec 11, 2025
 |
|
|
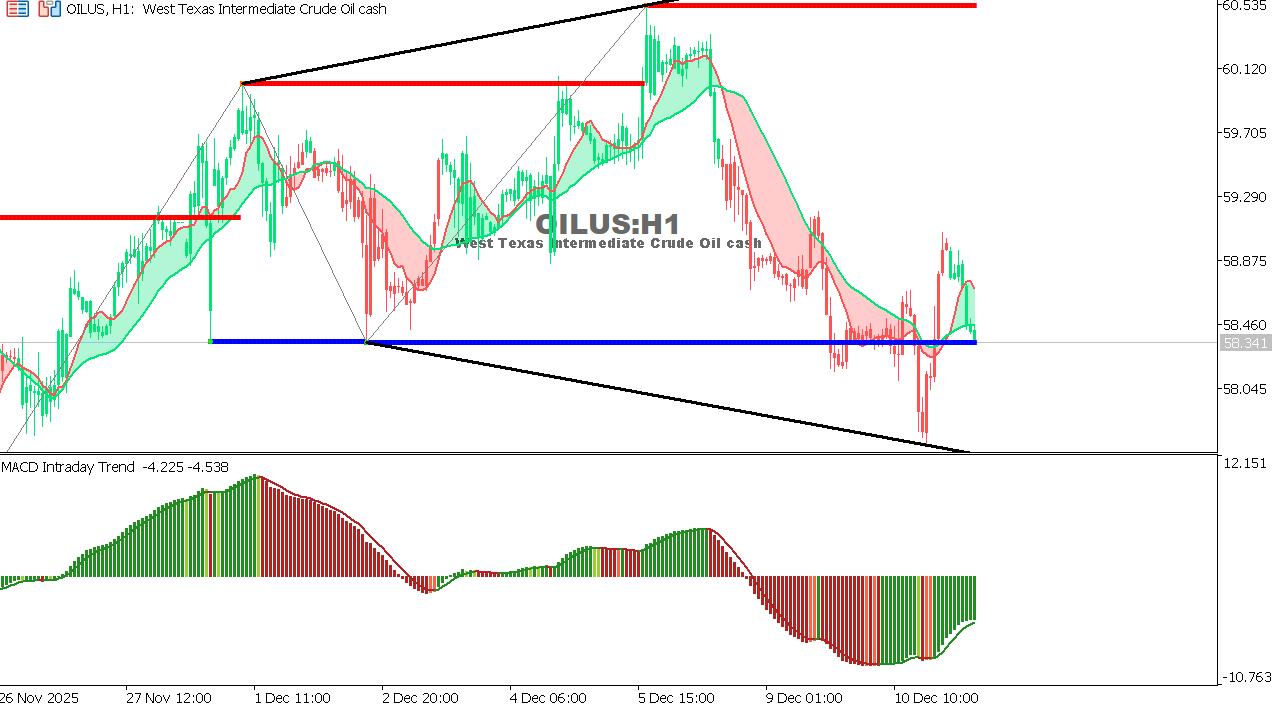 |
USOIL Chart on the hourly time frameOil is trading near a strong support zone at 58.00 after an extended decline driven by weak demand and risk aversion ahead of the interest rate decision. Overall Trend: Weak Bearish
Expectation: Movements will remain limited unless there is an improvement in market sentiment or a rise in global energy demand. |
 |
|
|
 |
|
|