FXEM - EMPIRE MARKETS - Company New Article
To access the website's classic version and the new accounts, please click here
Jun 23, 2025
 |
|
|
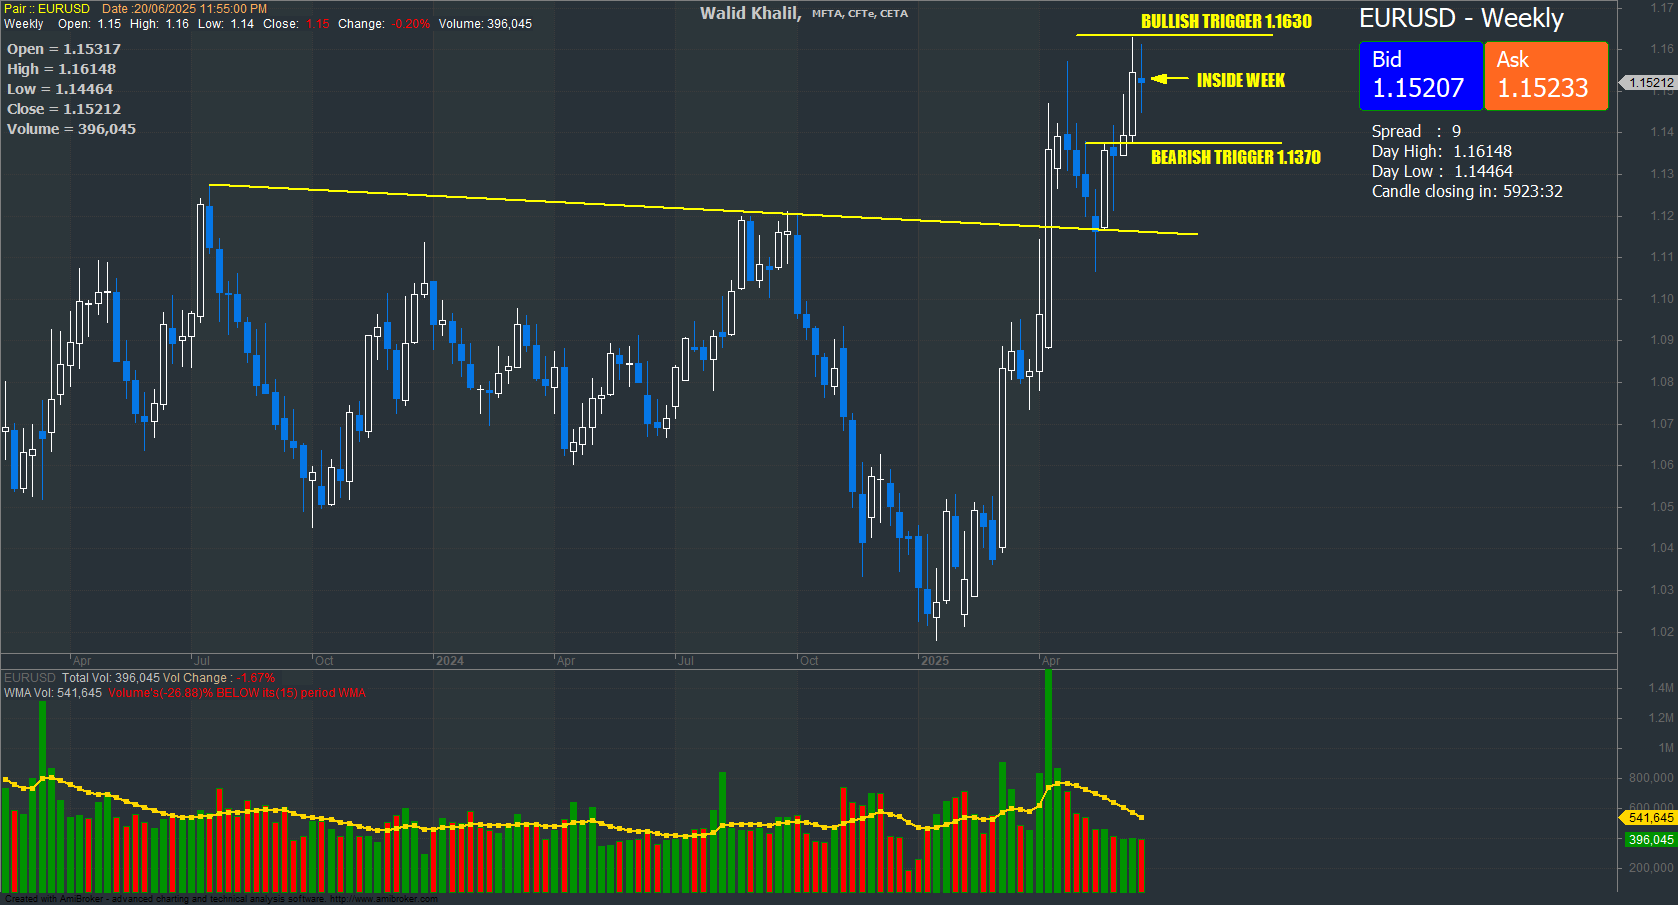 |
EURUSD Chart on the hourtly time frameDespite ongoing mixed signals on the daily chart, last week’s price action formed an inside candle, providing clear directional triggers. A decisive breakout above 1.1630 would confirm bullish momentum, opening the path toward our weekly target of 1.1900. Conversely, a breakdown below 1.1370 would invalidate the bullish bias and trigger a sell signal. Given the prevailing structure, we maintain a constructive outlook, favoring an upward move toward the 1.1900 target. As such, we advocate a buy-on-dips strategy, with an optimal entry zone around 1.1500. Key Levels:
Risk management remains crucial, and traders should monitor price action around the outlined levels for confirmation. |
 |
|
|