FXEM - EMPIRE MARKETS - Company New Article
To access the website's classic version and the new accounts, please click here
Sep 25, 2025
 |
|
|
 |
||
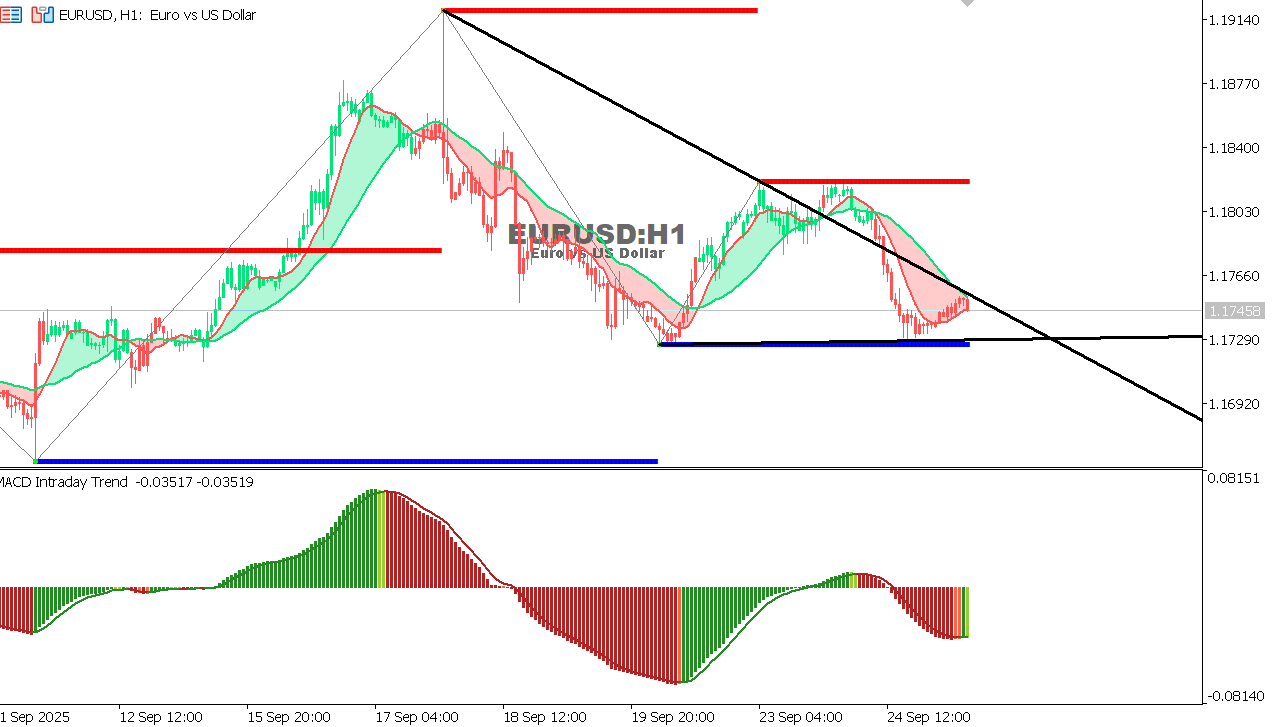
EUR/USD Chart on the hourtly time frameAnalysis: The pair is in a downtrend, but it's currently sitting on a strong support level around 1.1730. Some signs of a possible bounce are visible.
|