FXEM - EMPIRE MARKETS - Company New Article
To access the website's classic version and the new accounts, please click here
Sep 24, 2025
 |
|
|
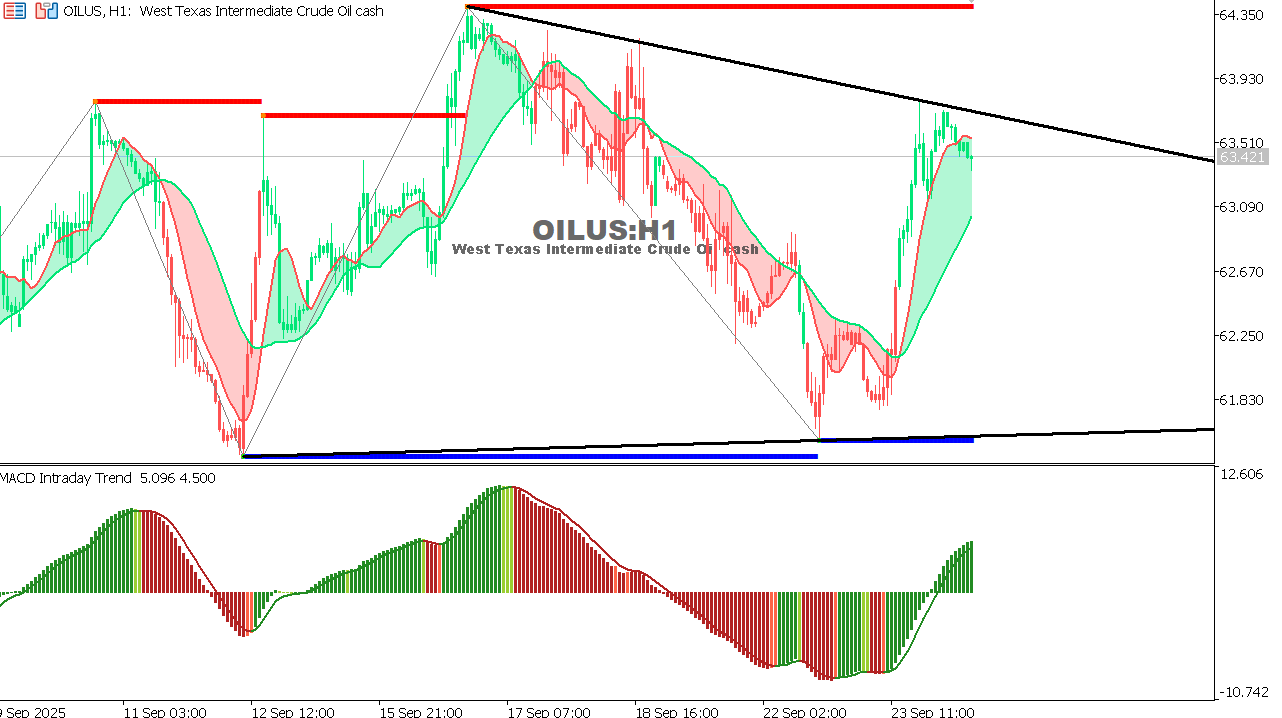 |
USOIL Chart on the hourtly time frameOil is trading at 63.42 after sustained selling pressure.
Stabilization below 64.20 maintains the negative outlook, with a possible retest of the 62.80 area.
|
 |
|
|
 |
|
|