FXEM - EMPIRE MARKETS - Company New Article

To access the website's classic version and the new accounts, please click here

May 29, 2025
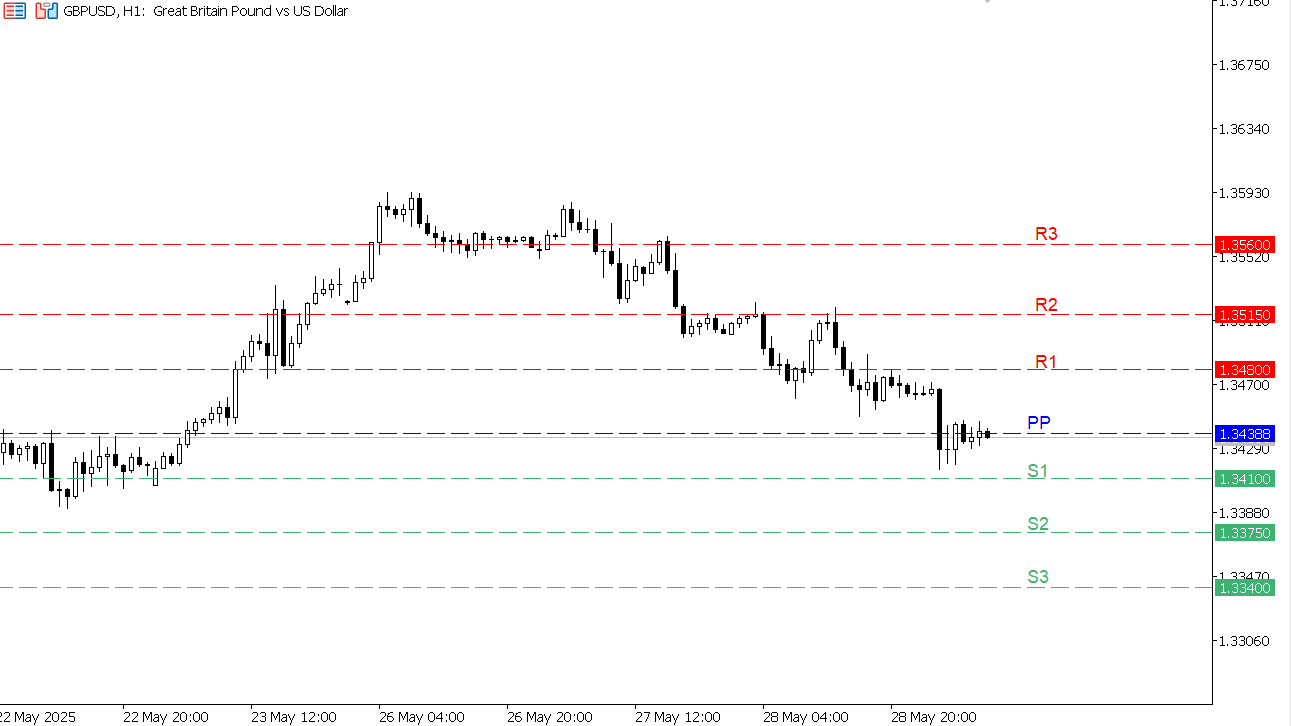
GBP/USD chart on the hourly time frame

GBP/USD chart on the hourly time frame

The pair is trading sideways after reaching the 1.3440 target yesterday, showing signs of temporary stability while awaiting cues from U.S. growth data.

  • Resistance Levels: 1.3480 – 1.3515 – 1.3560
  • Support Levels: 1.3410 – 1.3375 – 1.3340

Forecast: Continued sideways movement with limited upside correction expected unless negative economic data emerges.

Resistance 3 Resistance 2 Resistance 1 Pivot Point Support 1 Support 2 Support 3
1.3560
1.3515
1.3480
1.34388
1.3410
1.3375
1.3340

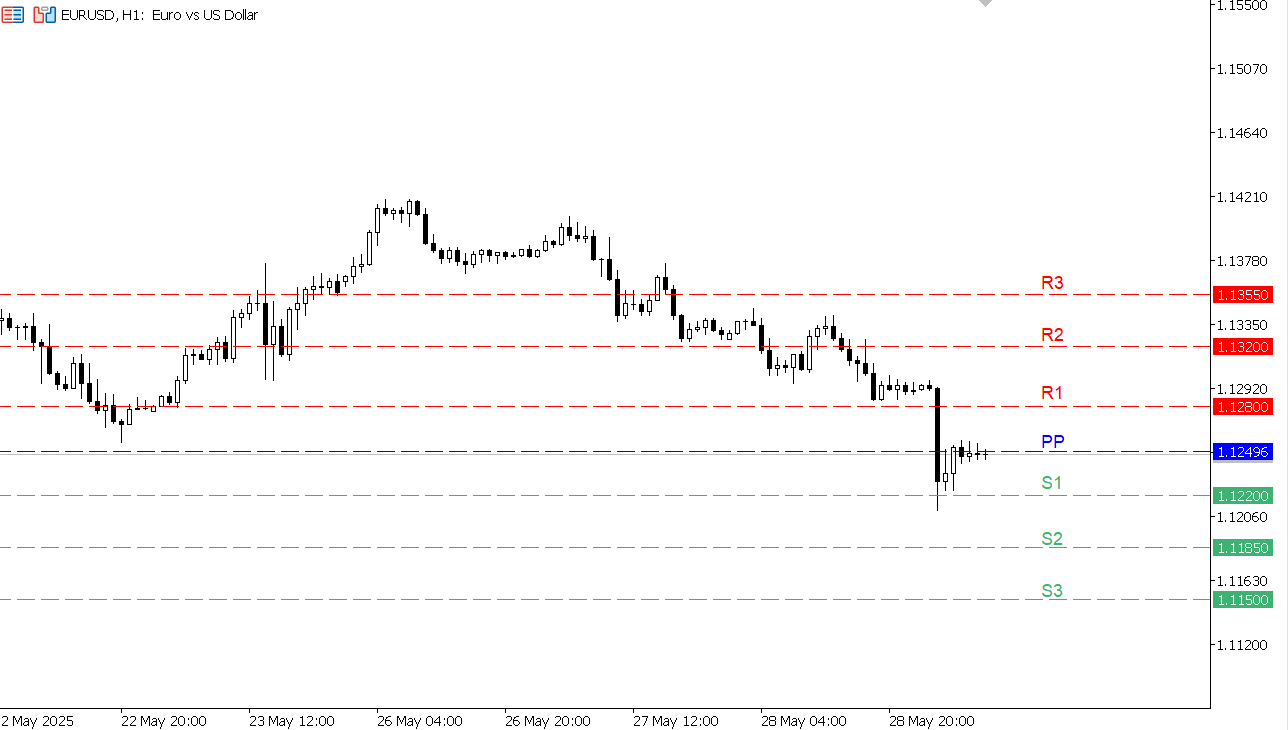
EUR/USD chart on the hourly time frame

EUR/USD chart on the hourly time frame

The pair successfully hit all its downside targets yesterday (1.1285 – 1.1250 – 1.1215) and now shows weakening momentum with the possibility of a short-term rebound.

  • Resistance Levels: 1.1280 – 1.1320 – 1.1355
  • Support Levels: 1.1220 – 1.1185 – 1.1150

Forecast: Slight bearish bias unless 1.1280 is broken with a confirmed close.

Resistance 3 Resistance 2 Resistance 1 Pivot Point Support 1 Support 2 Support 3
1.1355
1.1320
1.1280
1.12496
1.1220
1.1185
1.1150

 To open a real account click here

One Trading Account | 50+ Forex Pairs | 80+ Trading Instruments
Multi-Asset Trading Platforms

Cookie Policy
This website uses cookies to ensure you get the best experience on our website. We use cookies for proper website navigation and function and for statistical and analytical purposes. You can select the cookie categories that you would like to manage through the Cookies Settings at any time. Please configure your Cookies Settings before proceeding. To learn more, please read our Cookies Policy