FXEM - EMPIRE MARKETS - Company New Article

To access the website's classic version and the new accounts, please click here

May 29, 2025
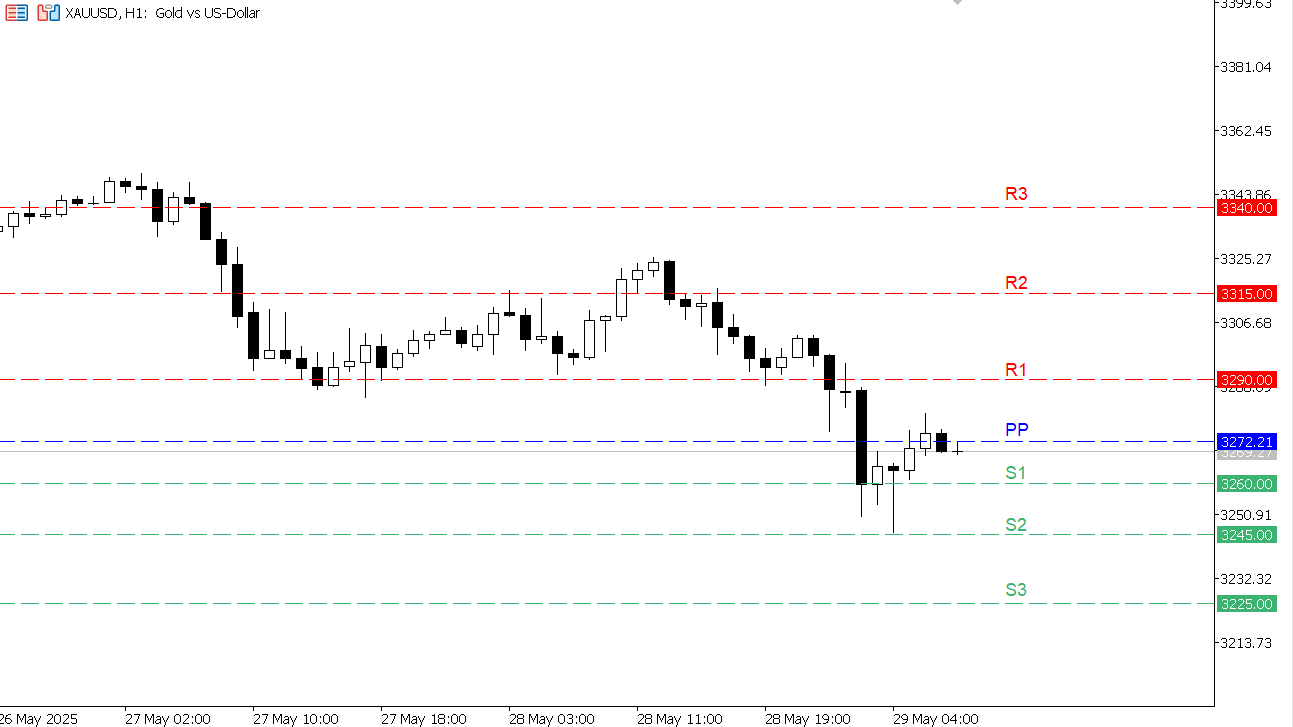
XAU/USD chart on the hourly time frame

XAU/USD chart on the hourly time frame

After hitting three bearish targets yesterday, gold is attempting a mild rebound from the 3245 level, amid ongoing volatility driven by falling U.S. yields.

  • Resistance Levels: 3290 – 3315 – 3340
  • Support Levels: 3260 – 3245 – 3225

Forecast: Potential technical rebound if prices hold above 3260; market risk sentiment remains a key factor.

Resistance 3 Resistance 2 Resistance 1 Pivot Point Support 1 Support 2 Support 3
3340
3315
3290
3272.21
3260
3245
3225

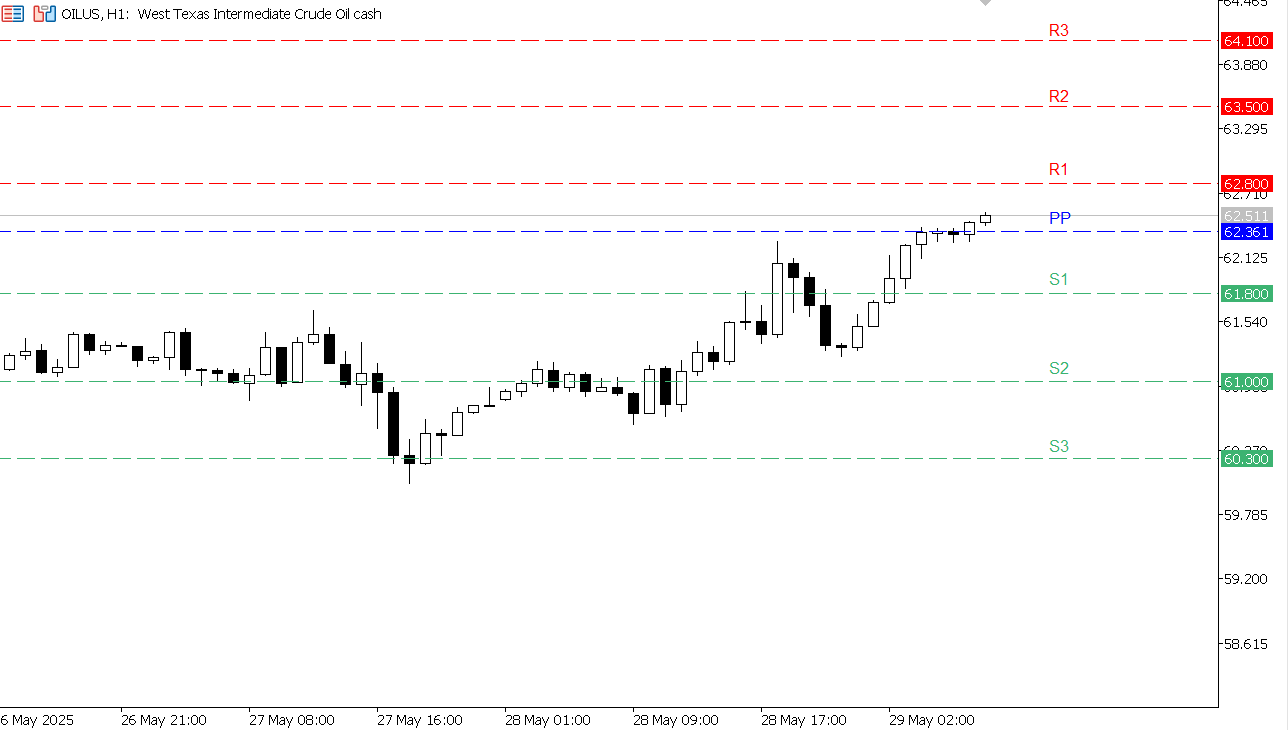
USOIL chart on the hourly time frame

USOIL chart on the hourly time frame

After reaching the targets at 61.50 and 62.10, oil is now trading in an overbought zone without clear signs of selling pressure yet.
  • Resistance Levels: 62.80 – 63.50 – 64.10
  • Support Levels: 61.80 – 61.00 – 60.30

Forecast: Range-bound movement above 62 likely to continue; however, a break above 63.00 may restore bullish momentum.

Resistance 3 Resistance 2 Resistance 1 Pivot Point Support 1 Support 2 Support 3
64.10
63.50
62.80
62.361
61.80
61.00
60.30

To open a real account click here

One Trading Account | 50+ Forex Pairs | 80+ Trading Instruments
Multi-Asset Trading Platforms

Cookie Policy
This website uses cookies to ensure you get the best experience on our website. We use cookies for proper website navigation and function and for statistical and analytical purposes. You can select the cookie categories that you would like to manage through the Cookies Settings at any time. Please configure your Cookies Settings before proceeding. To learn more, please read our Cookies Policy