FXEM - EMPIRE MARKETS - Company New Article
To access the website's classic version and the new accounts, please click here
Jun 05, 2025
 |
|
|
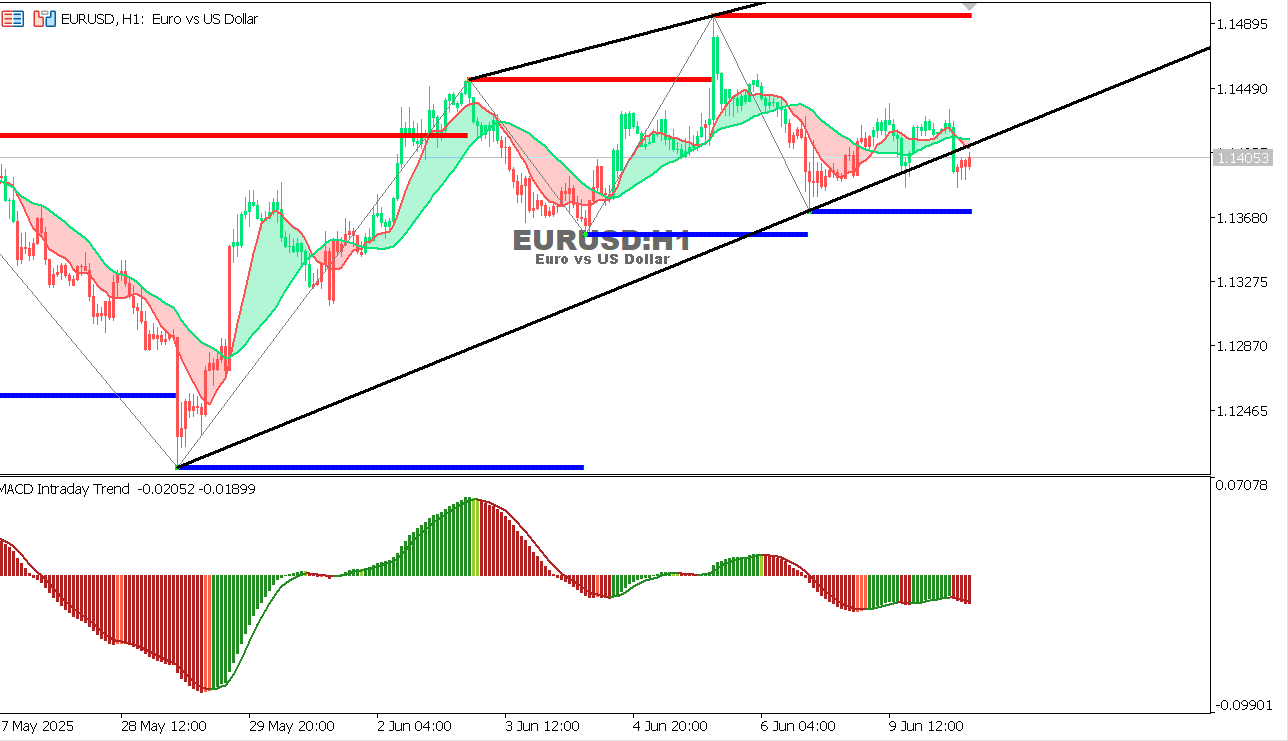 |
EUR/USD Chart on the hourtly time frameAs we mentioned yesterday: What actually happened: Current situation: Forecast: |
 |
|
|