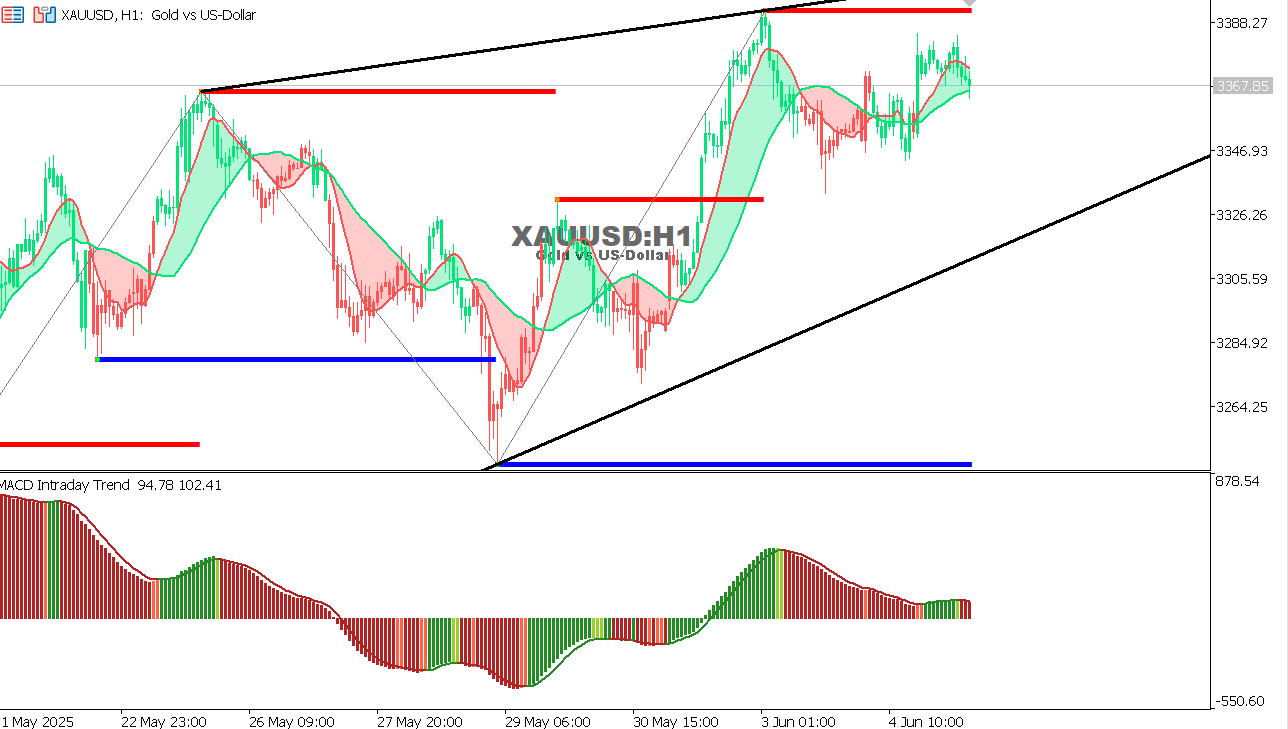
As we mentioned yesterday, gold was moving within an ascending expansion channel, and we stated that: - Holding above 3340 could push the price toward 3380 and then 3400, and a break below 3340 could send the price back toward 3320 and possibly 3253.
What actually happened:
Gold held above 3340 and rebounded upwards.
It approached the first target of 3380 and reached levels very close to it (around 3375–3378).
After that, some volatility and weakening momentum began to appear.
Current situation:
The positive momentum on the MACD indicator has begun to decline, which may indicate the possibility of temporary profit-taking.
The ascending channel remains intact, but movement has become more cautious.
Expectations:
Stabilization above 3367 opens the door for a new attempt to break 3380 and reach 3400.
A break of 3340 could lead to a retest of 3320 in the short term.
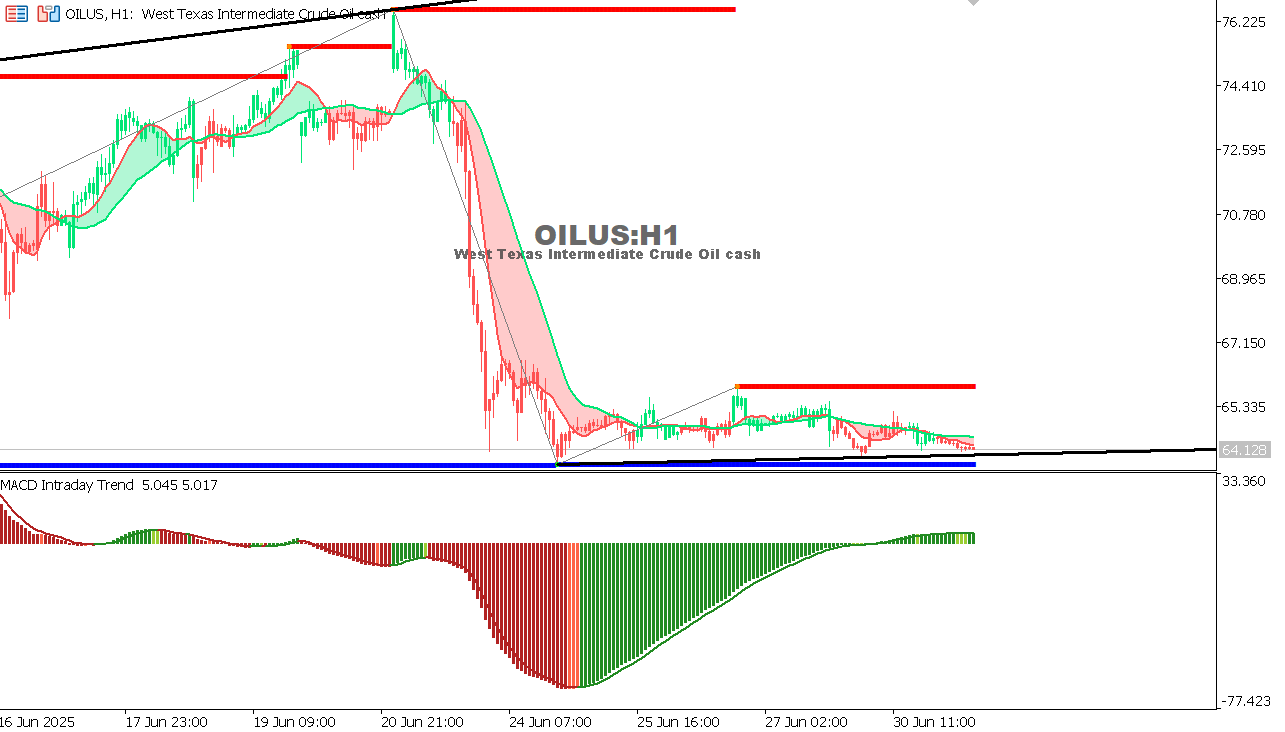
USOIL Chart on the hourtly time frame
As we mentioned yesterday:
Oil was within an expanding triangular channel, and we indicated: Stabilization above 62.20–62.50 = a rise to 63.25 and then 63.90 - Breaking 62.20 = a decline towards 61.25 and then 60.60
What actually happened:
The price actually maintained stability above 62.50 - The first target at 63.25 was successfully achieved.
The price is currently fluctuating below 63.90 without breaking it yet.
Current Status:
MACD: Positive momentum has slowed slightly but remains positive.
The price is close to the pivotal resistance level of 63.90 and may need additional buying power to break it.
Expectations:
Continued stability above 62.90 supports a continued rise to 63.90 and then 64.50.
Any break below 62.90 could send the price back to 61.70.
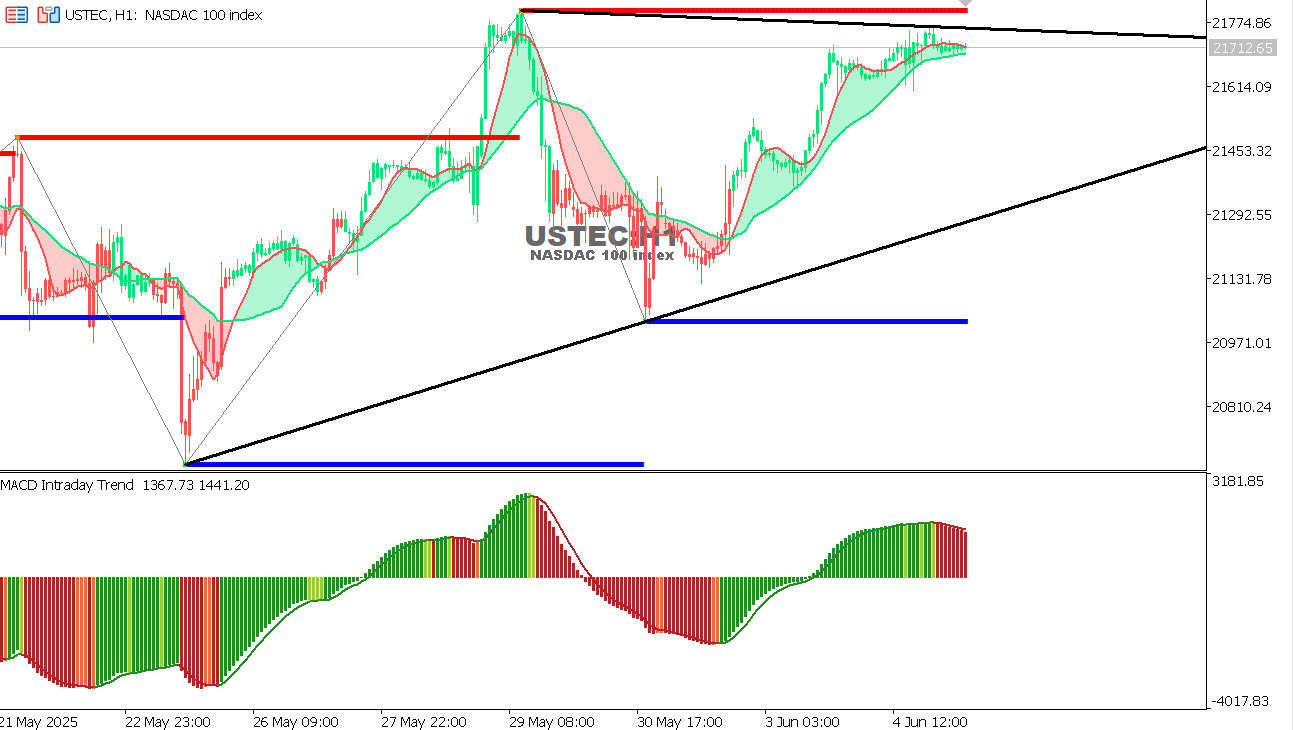
USTEC chart on the hourly time frame
As we mentioned yesterday:
The Nasdaq was within a symmetrical triangle, and the probabilities were: Consolidation above 21580 = a rise to 21770 and then 21900 - A break below 21450 = a decline to 21130 and then 20970.
What actually happened:
The price maintained trading above 21580 - the first target of 21770 was accurately reached - the index is currently trading between 21700 and 21750.
Current Status:
MACD: Still positive but starting to lose momentum → Indicates a possible temporary pullback - the price is maintaining the upper band but with clear fluctuations.
Expectations:
Continued stability above 21630 supports a retest of 21900.
A break below 21550 could push the index lower towards 21370.
This website uses cookies to ensure you get the best experience on our website. We use cookies for proper website navigation and function and for statistical and analytical purposes. You can select the cookie categories that you would like to manage through the Cookies Settings at any time. Please configure your Cookies Settings before proceeding. To learn more, please read our Cookies Policy
We use cookies to ensure the best possible experience as a guest in our site. Please configure your cookies settings before proceeding.
Necessary
Always active
These cookies are strictly necessary to enable you to move about the website and to provide certain features you have requested. There is no need for consent for the use of such cookies.