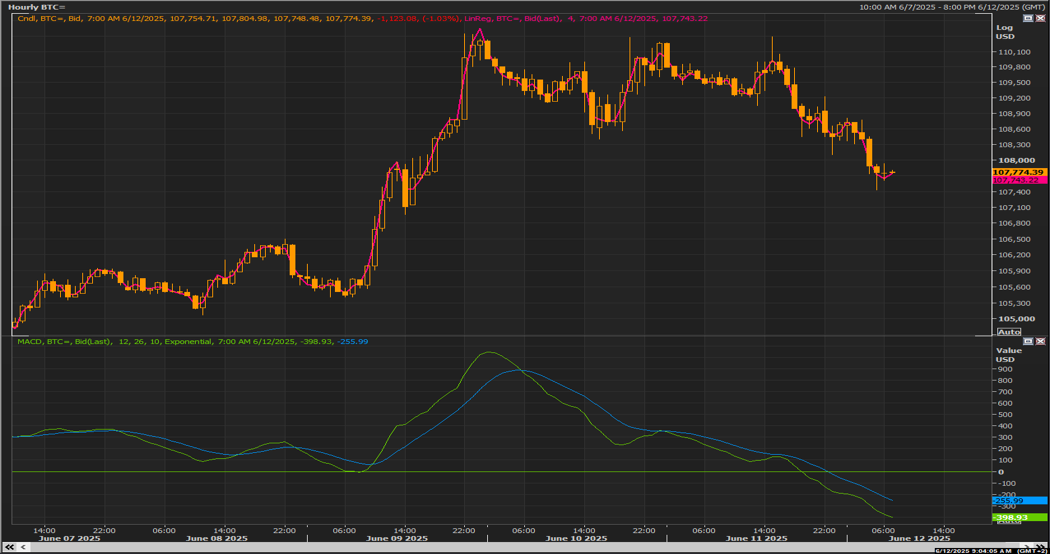
“Currently, BTC recovery rally is seen as extended on the hourly time frame and subject to a pull-back. But before that, we expect another attempt to re-test the 109,800 – 110,300 today.
Then, we expect another decline towards 107,000 – 107,500. ”
The BTC did confirm this scenario and is now trading at the previously stated range of (107-107.50) K.
We are likely to re-visit (108.10 – 108.40) K. before heading towards 106 K.
This website uses cookies to ensure you get the best experience on our website. We use cookies for proper website navigation and function and for statistical and analytical purposes. You can select the cookie categories that you would like to manage through the Cookies Settings at any time. Please configure your Cookies Settings before proceeding. To learn more, please read our Cookies Policy
We use cookies to ensure the best possible experience as a guest in our site. Please configure your cookies settings before proceeding.
Necessary
Always active
These cookies are strictly necessary to enable you to move about the website and to provide certain features you have requested. There is no need for consent for the use of such cookies.