FXEM - EMPIRE MARKETS - Company New Article
To access the website's classic version and the new accounts, please click here
Jun 12, 2025
 |
|
|
 |
||
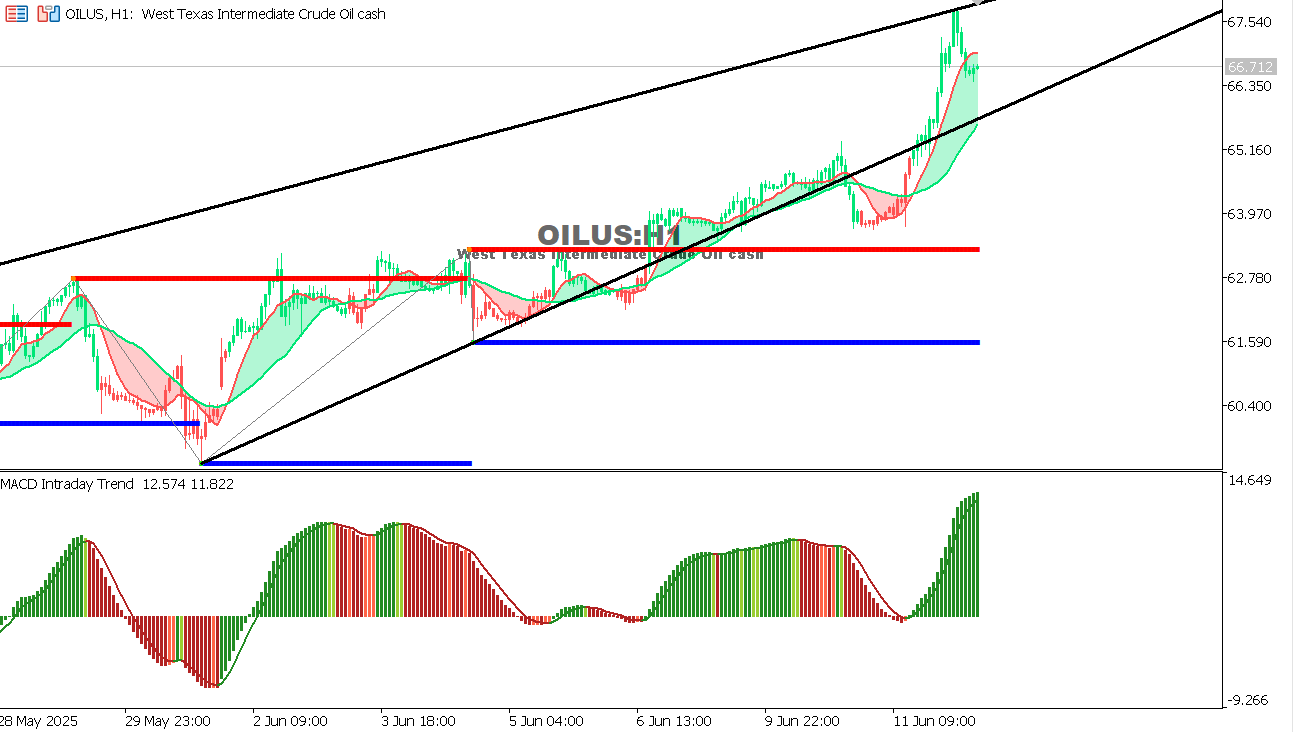
USOIL Chart on the hourtly time frameOverall Trend: Clearly bullish within an ascending channel.
|