FXEM - EMPIRE MARKETS - Company New Article
To access the website's classic version and the new accounts, please click here
Jan 28, 2026
 |
|
|
 |
||
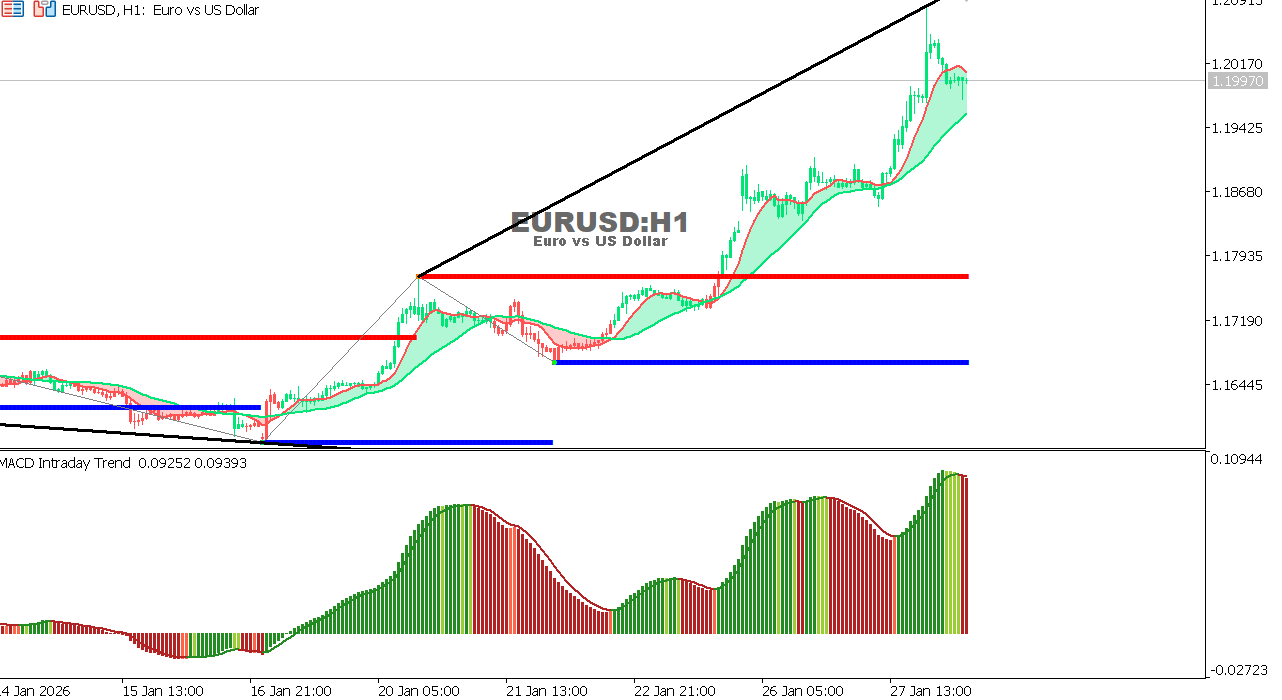
EUR/USD Chart on the hourtly time frameThe pair continues to trade within an upward trend on the hourly chart after a clear break above previous resistance levels. The price is currently moving near recent highs, remaining above the moving averages, reflecting continued buying pressure despite some signs of a slight slowdown in momentum. Overall Trend: Upward with a Corrective Tide Expectation: Holding above support maintains the bullish scenario, while a break below it could push the price back towards 1.1920 before any new upward attempt.
|