FXEM - EMPIRE MARKETS - Company New Article
To access the website's classic version and the new accounts, please click here
Jan 28, 2026
 |
|
|
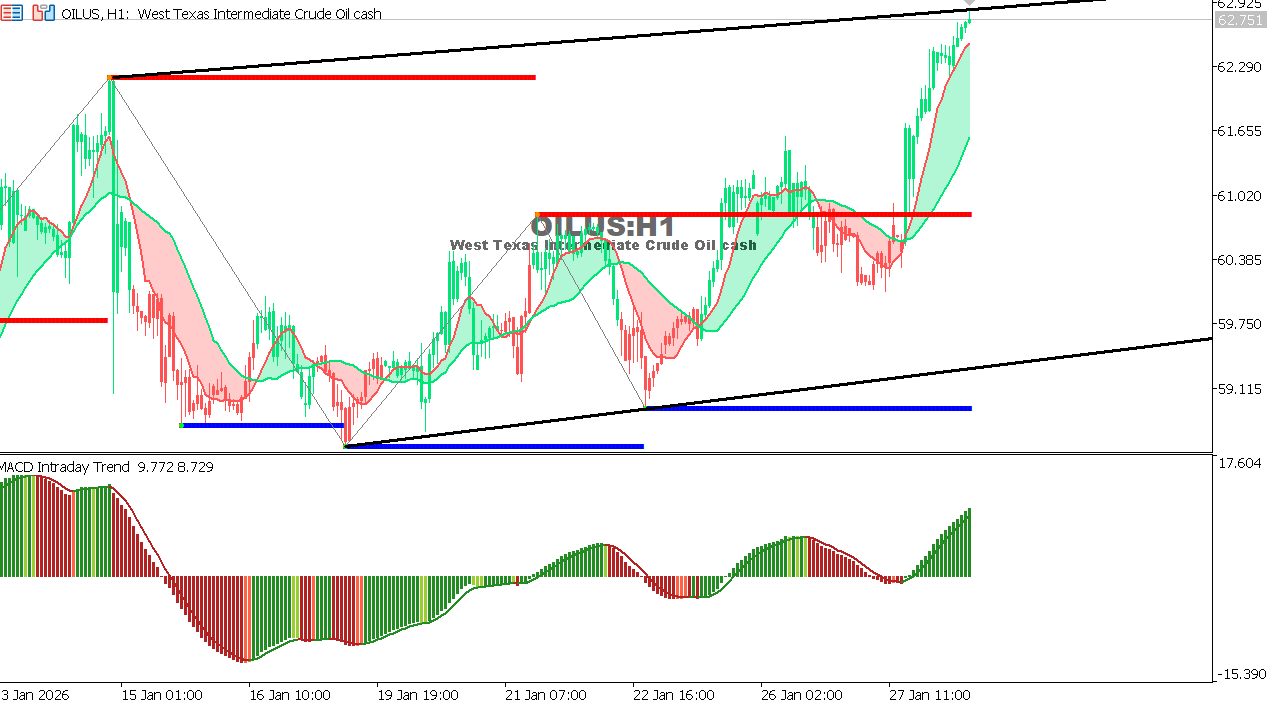 |
USOIL Chart on the hourly time frameOil is moving in a moderately upward range after a clear rebound from lower levels, with the price stabilizing above key support zones. Current trading suggests an attempt to establish a price base in preparation for further gains. Overall Trend: Neutral with a slight upward bias Expectation: A break above resistance reinforces the bullish scenario, while a break below support would return the price to a weaker sideways range.
|
 |
|
|
 |
|
|