FXEM - EMPIRE MARKETS - Company New Article
To access the website's classic version and the new accounts, please click here
Sep 26, 2025
 |
|
|
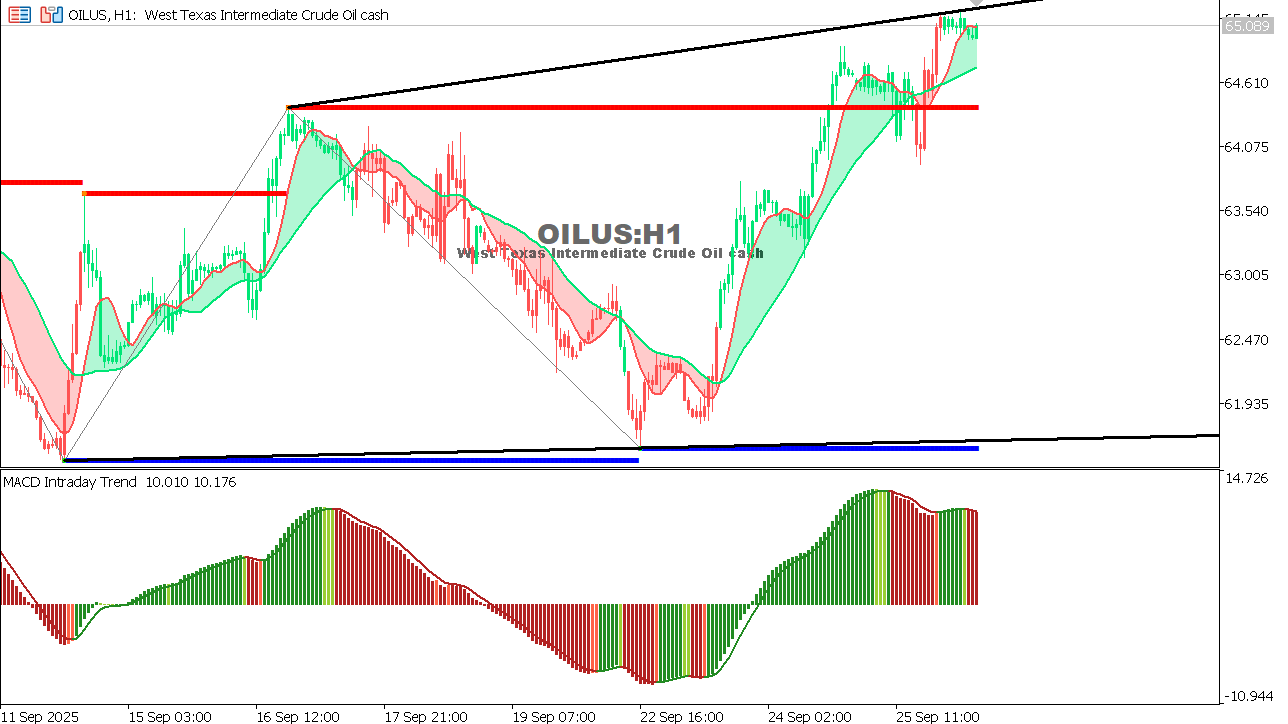 |
USOIL Chart on the hourtly time frameOil trades at relatively weak levels under pressure from demand concerns.
|
 |
|
|
 |
|
|