FXEM - EMPIRE MARKETS - Company New Article
To access the website's classic version and the new accounts, please click here
Oct 21, 2025
 |
|
|
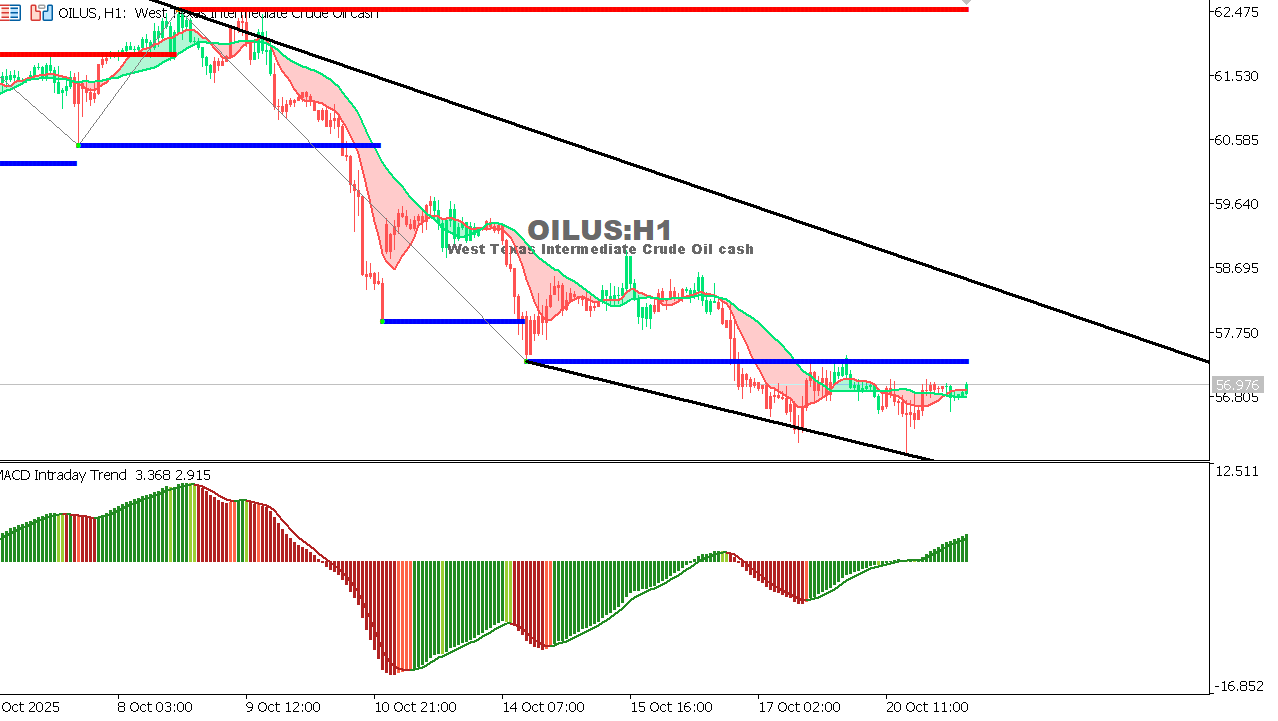 |
USOIL Chart on the hourtly time frameOil trades near $56.97, holding steady after limited fluctuations.
Support: 56.20 – 55.60
|
 |
|
|
 |
|
|