FXEM - EMPIRE MARKETS - Company New Article
To access the website's classic version and the new accounts, please click here
Nov 25, 2025
 |
|
|
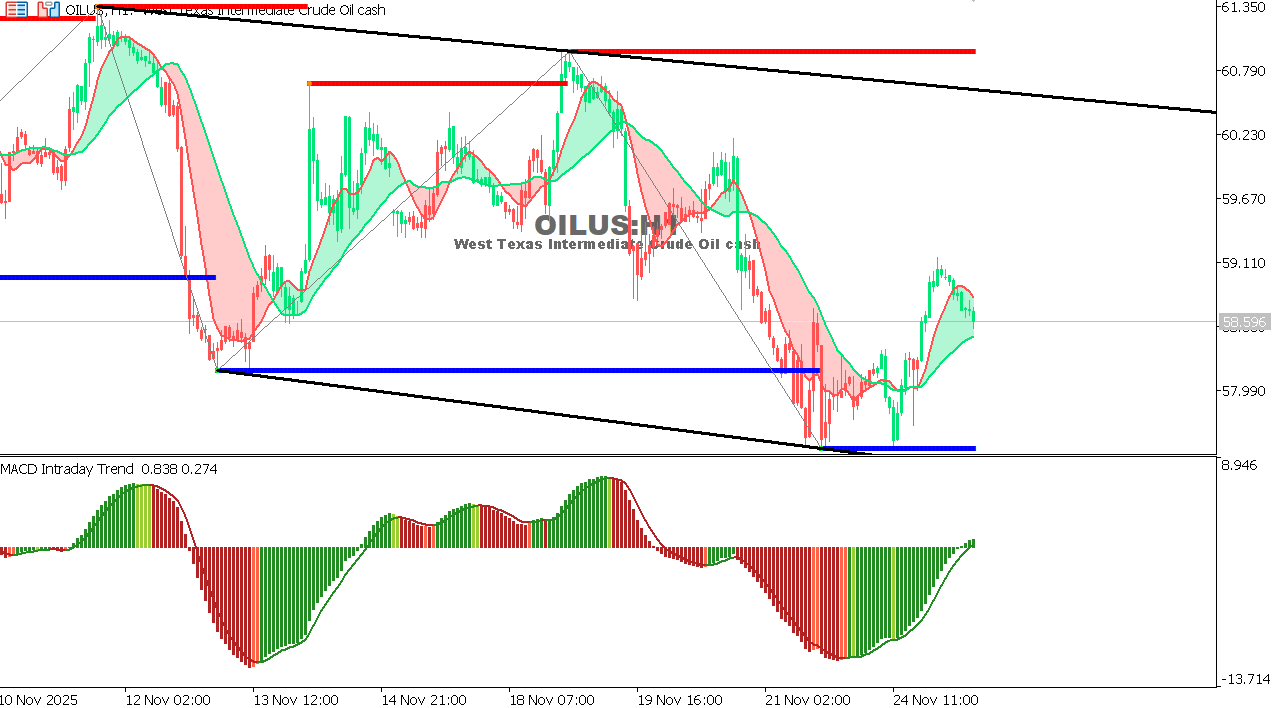 |
USOIL Chart on the hourly time frameOil continues to trade in a narrow sideways range after a strong downward move, with a lack of clear buying momentum. The 59.20 level is a significant technical resistance, while 57.80 remains a key support level. Overall Trend: Neutral Expectation: Observe the breakout range before determining the direction.
|
 |
|
|
 |
|
|