FXEM - EMPIRE MARKETS - Company New Article
To access the website's classic version and the new accounts, please click here
Nov 24, 2025
 |
|
|
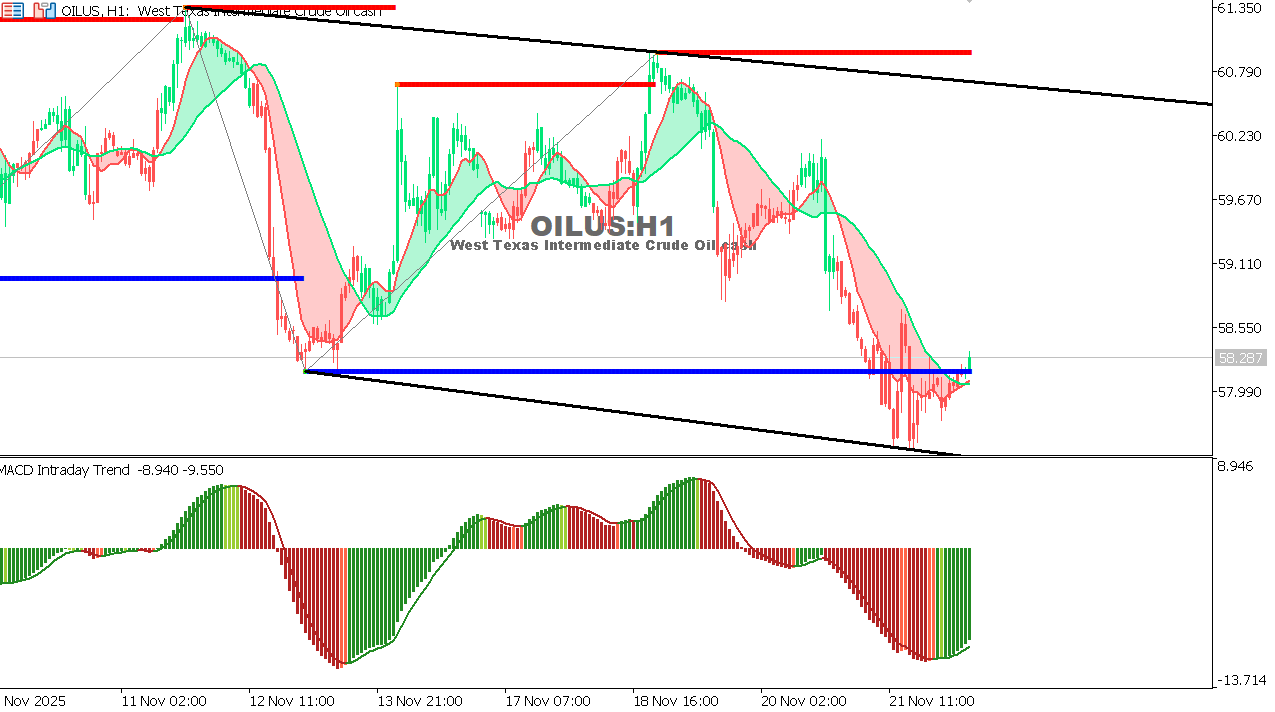 |
USOIL Chart on the hourly time frameOil is moving near a key historical support level around $58.00 after a sharp sell-off driven by expectations of slowing global demand. The price is showing signs of oversold conditions, but no clear reversal has yet materialized. Overall Trend: Bearish Support: $58.00 – $56.90 Resistance: $60.20 – $62.00 Expectation: As long as the price remains above $58.00, the possibility of a rebound remains, but a break below this level would deepen the decline towards $56.90.
|
 |
|
|
 |
|
|