FXEM - EMPIRE MARKETS - Company New Article
To access the website's classic version and the new accounts, please click here
Jun 27, 2025
 |
|
|
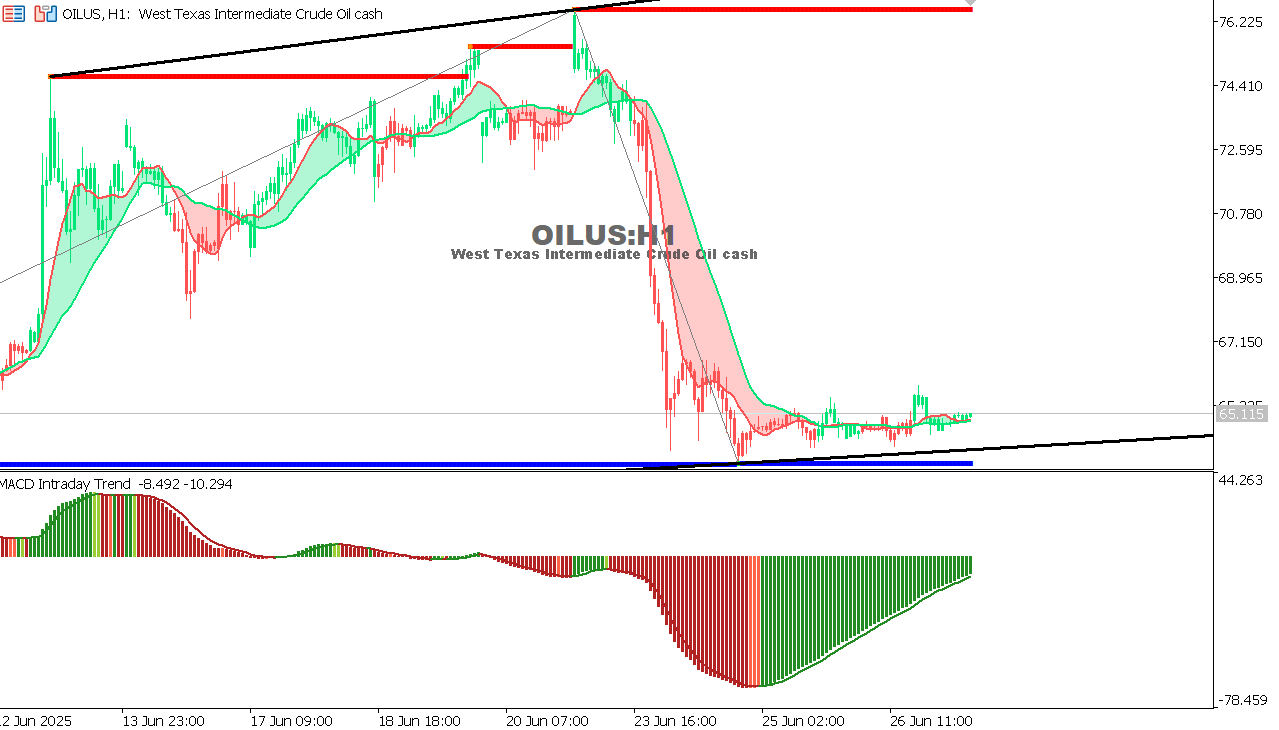 |
USOIL Chart on the hourtly time frameAs we expected yesterday, the decline will continue towards 63.80 and then 62.50. General trend: Bearish Description: Oil continues trading below the 66 level with clear selling pressure after failing to break the recent resistance. Indicators:
Expectation:
|
 |
|
|
 |
|
|