FXEM - EMPIRE MARKETS - Company New Article
To access the website's classic version and the new accounts, please click here
Jun 18, 2025
 |
|
|
 |
||
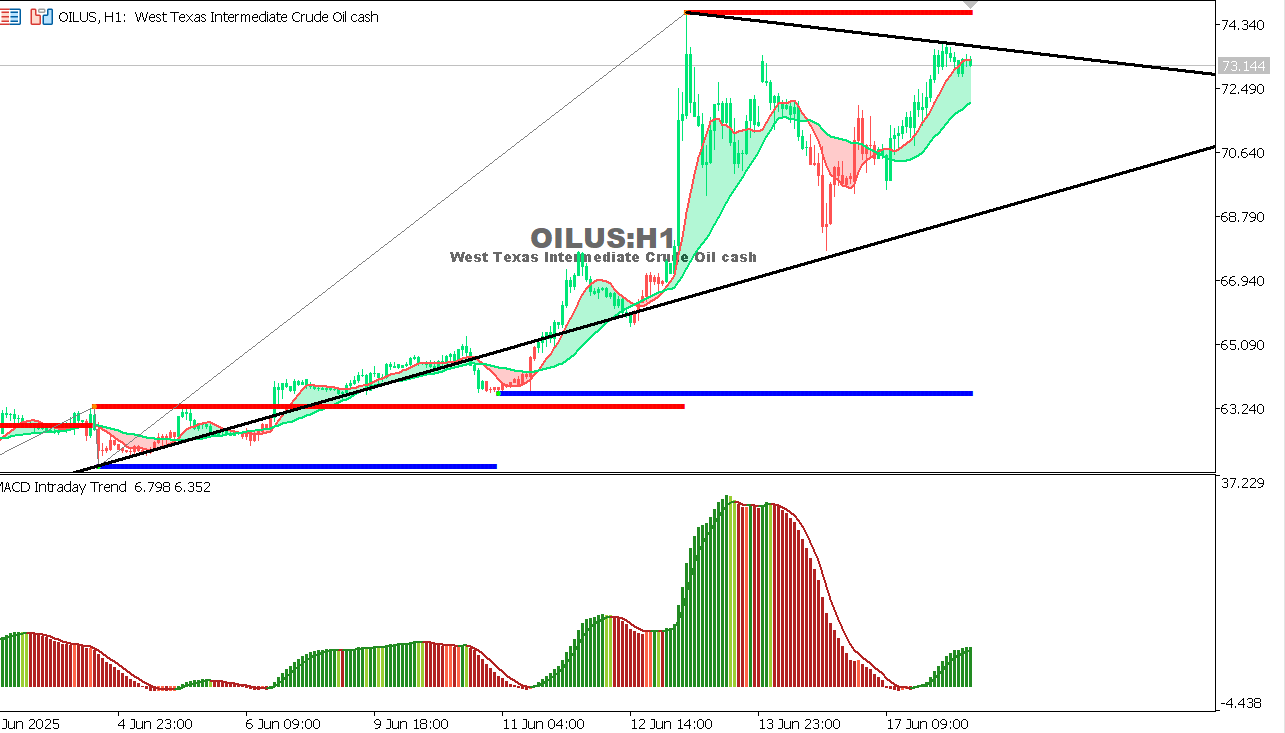
USOIL Chart on the hourtly time frameUS crude oil prices have witnessed a strong rise over the recent period, supported by the break of previous resistance areas and the establishment of new price highs. However, the price is now facing strong resistance near the $74.30 level, an area forming a double top that may hinder the continuation of the upward trend in the short term.
Expectation:
|