FXEM - EMPIRE MARKETS - Company New Article
To access the website's classic version and the new accounts, please click here
Apr 22, 2026
Technical analysis of some commodities pairs:
Technical Analysis Report (April 22, 2026):
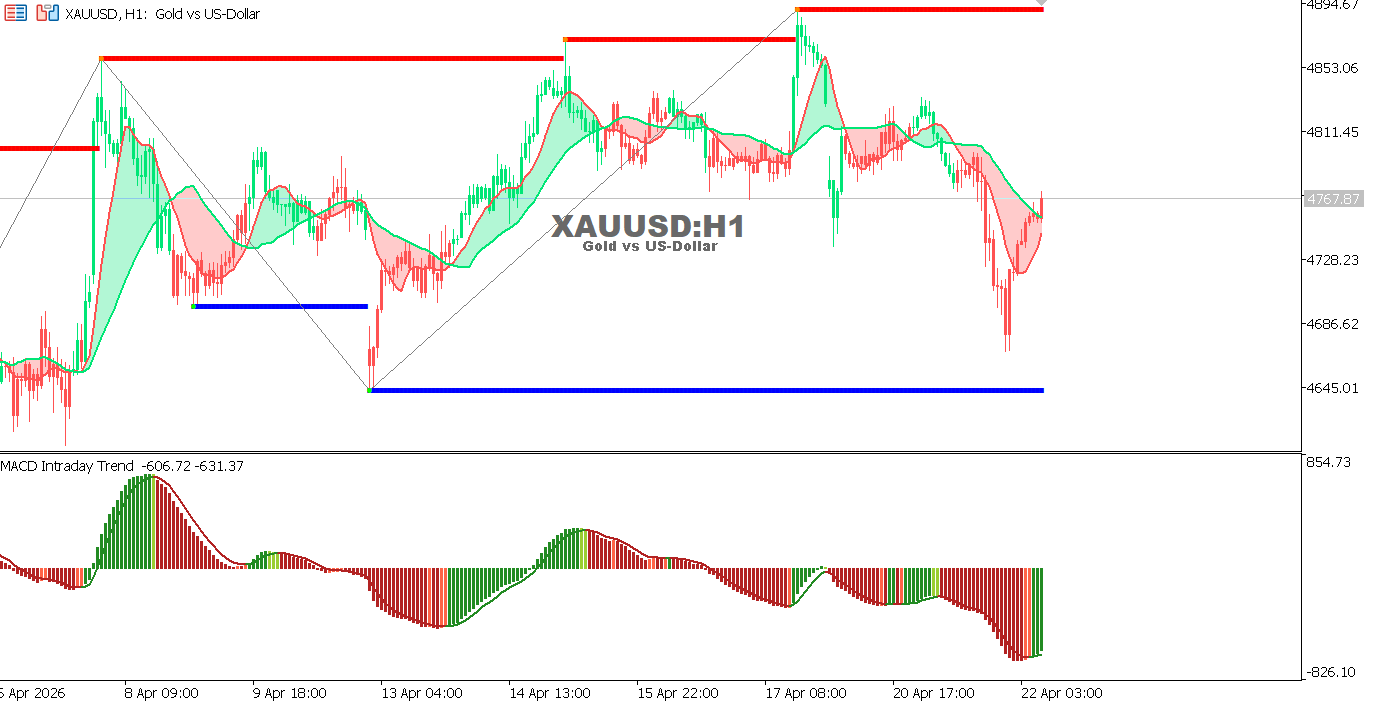
XAUUSD Hourly Chart
Gold is trading near 4767 after a sharp decline from strong resistance levels, with continued selling pressure.
The MACD is deep in negative territory, reflecting accelerating bearish momentum.
- Trend: Bullish (strong bearish correction)
- Support: 4740 – 4640
- Resistance: 4810 – 4890
Outlook:
A move back above 4810 may support a corrective rebound, while a break below 4740 could extend the decline toward lower levels.
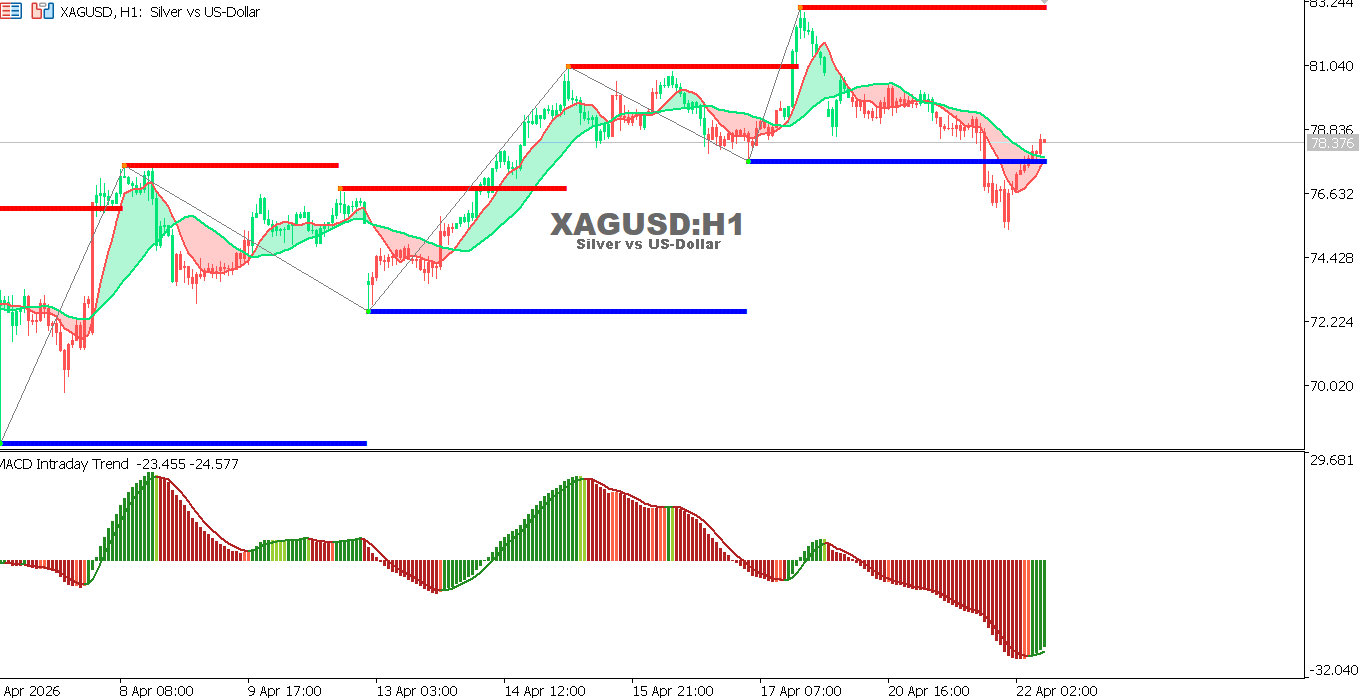
XAGUSD Hourly Chart
Silver is trading near 78.30 after rebounding from a support area, with early signs of momentum recovery.
The MACD remains in negative territory but is showing signs of weakening bearish momentum.
- Trend: Bullish (bearish correction)
- Support: 77.00 – 72.20
- Resistance: 81.00 – 83.20
Outlook:
Holding above 77.00 supports continued recovery, while a break below it may renew downside pressure.
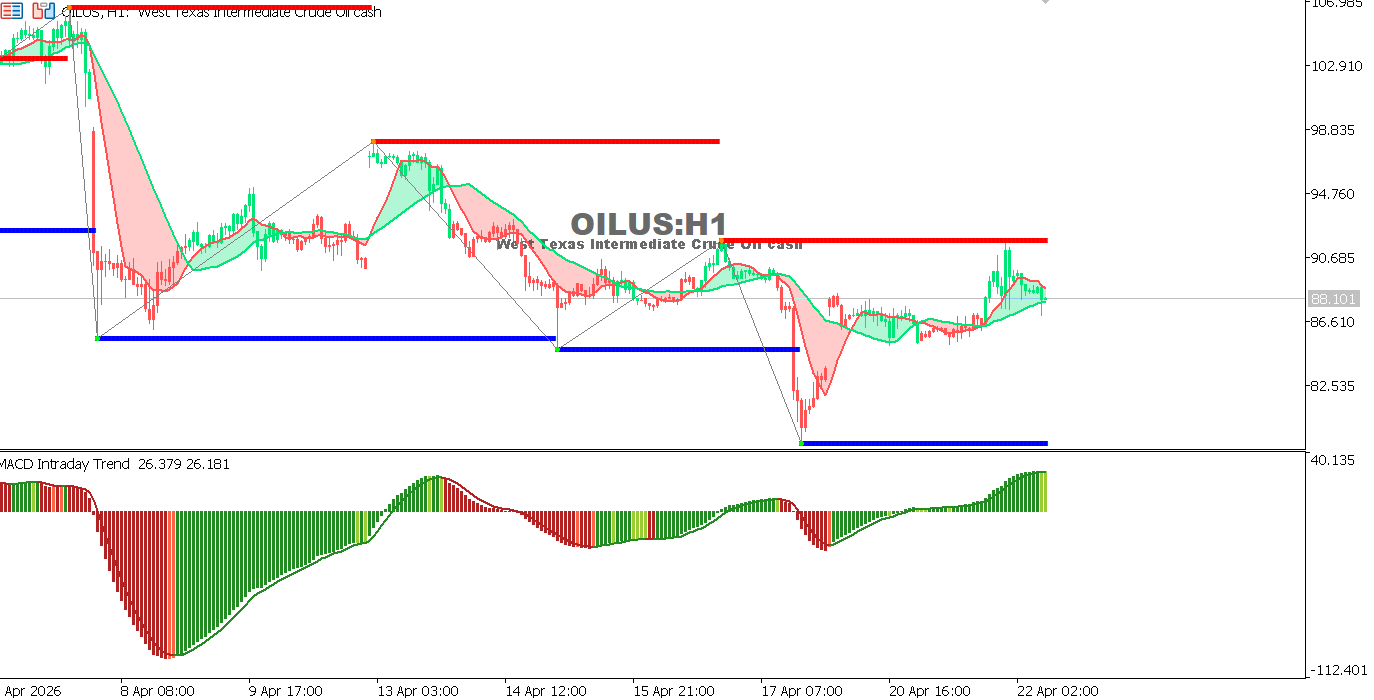
USOIL Hourly Chart
Oil is trading near 88.10 after rebounding from a strong support zone, with a gradual improvement in bullish momentum.
The MACD indicator is moving in positive territory, suggesting a recovery in buying pressure.
- Trend: Bearish (bullish correction)
- Support: 86.50 – 82.50
- Resistance: 90.70 – 98.80
Outlook:
A break above 90.70 may support further upside correction, while a drop below 86.50 could bring back selling pressure toward lower levels.
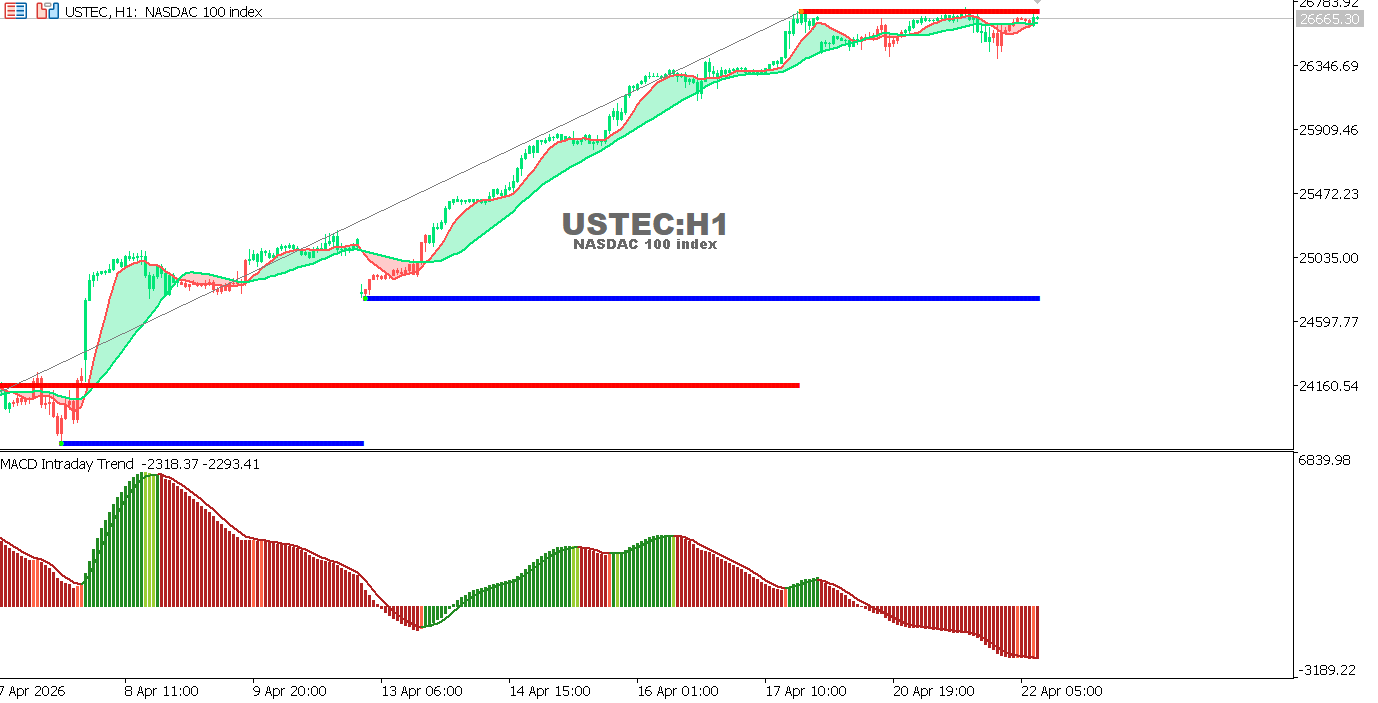
USTEC Hourly Chart
The index is trading near 26650, close to record highs, maintaining its uptrend but with weakening momentum.
The MACD is deep in negative territory, indicating a potential corrective phase.
- Trend: Bullish (bearish correction)
- Support: 26350 – 24590
- Resistance: 26780 – 26850
Outlook:
Holding above 26350 supports the continuation of the uptrend, while a break below it may lead to further correction.
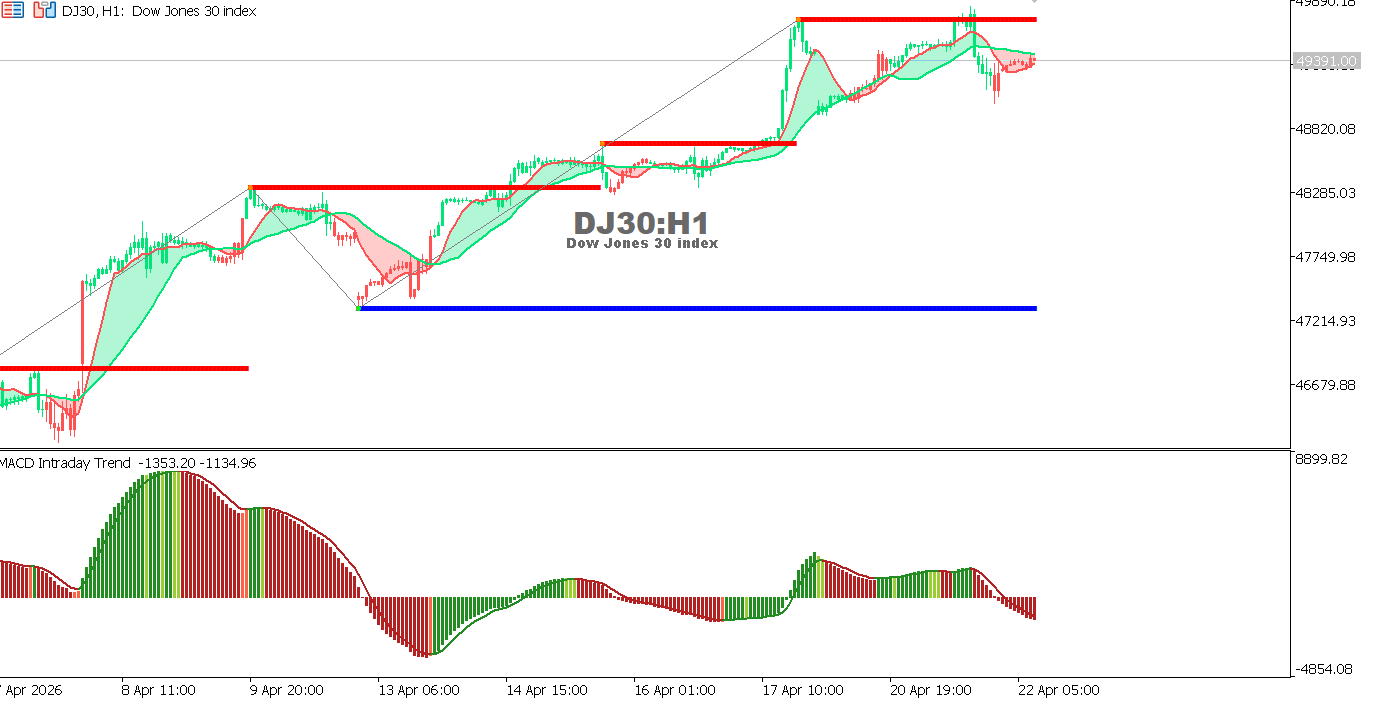
US30 Hourly Chart
The index is trading near 49390 after a slight pullback from a strong resistance zone, with signs of weakening bullish momentum.
The MACD is moving in negative territory, reflecting a slowdown in buying pressure.
- Trend: Bullish (bearish correction)
- Support: 48820 – 47210
- Resistance: 49890 – 50000
Outlook:
A break above 49890 may support a continuation of the uptrend, while a drop below 48820 could strengthen the corrective downside move.