FXEM - EMPIRE MARKETS - Company New Article
To access the website's classic version and the new accounts, please click here
Apr 21, 2026
Technical analysis of some commodities pairs:
Technical Analysis Report (April 21, 2026):
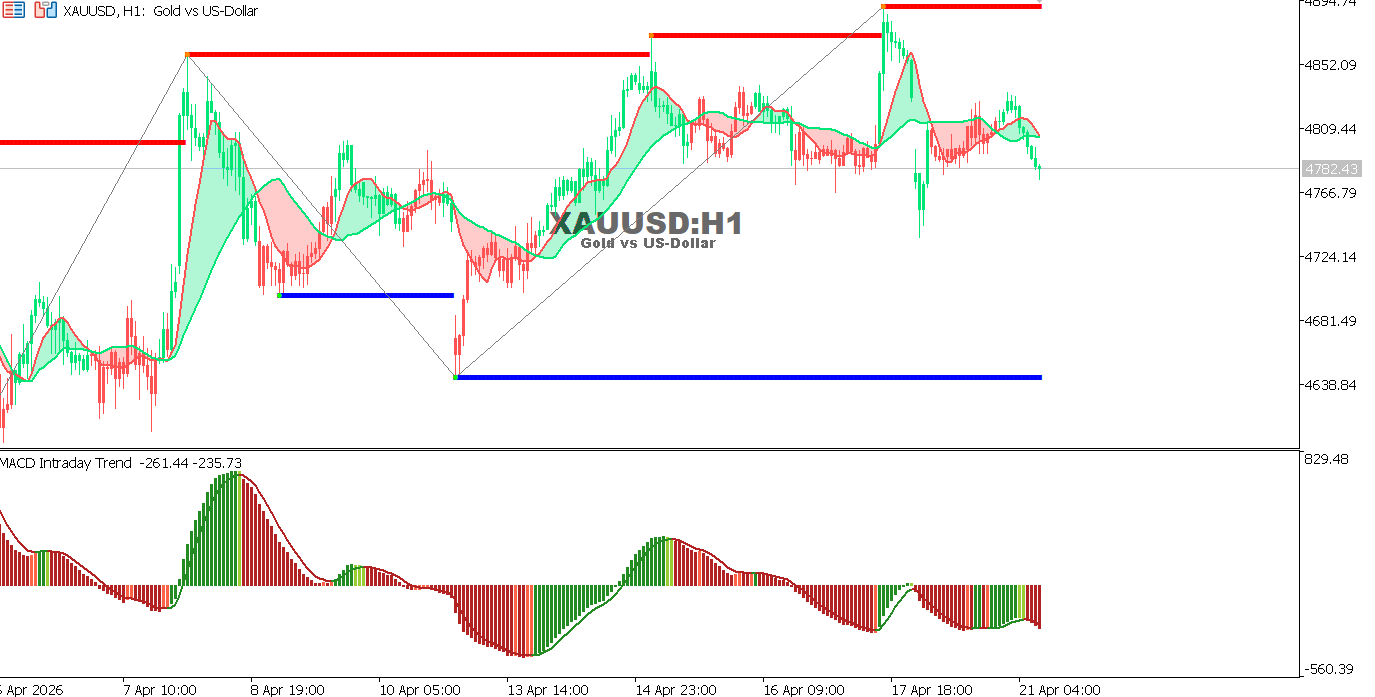
XAUUSD Hourly Chart
Gold is trading near 4780 after being rejected from resistance, with selling pressure returning.
The MACD indicator shows increasing negative momentum.
- Overall trend: Upward (Downward correction)
- Support: 4740 – 4640
- Resistance: 4850 – 4890
Expectation:
A return above 4850 would support a renewed upward move, while a break below 4740 would reinforce the correction.
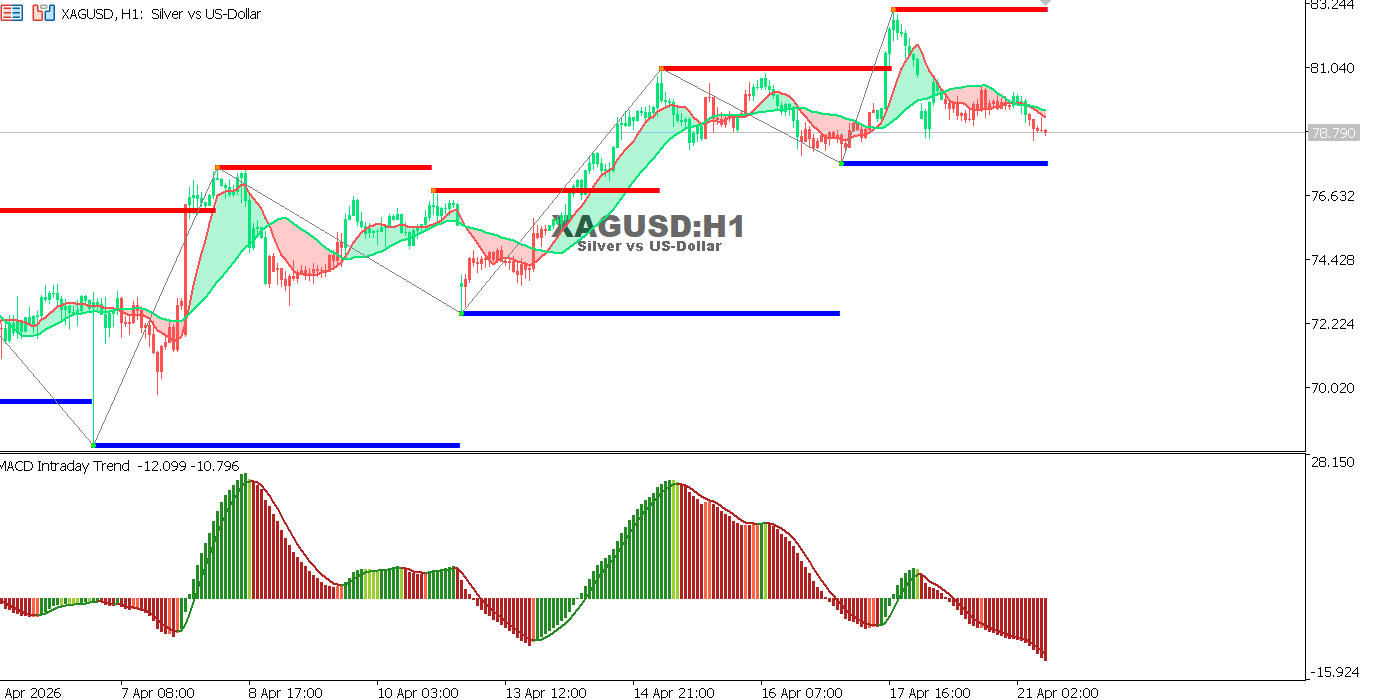
XAGUSD Hourly Chart
Silver is trading near 78.80 after pulling back from resistance, with increasing selling pressure.
The MACD indicator is moving in negative territory, reflecting weak momentum.
- Overall trend: Upward (Downward correction)
- Support: 78.00 – 72.50
- Resistance: 81.00 – 83.20
Expectation:
A break above 81.00 would reinstate the upward trend, while a break below 78.00 would support further declines.
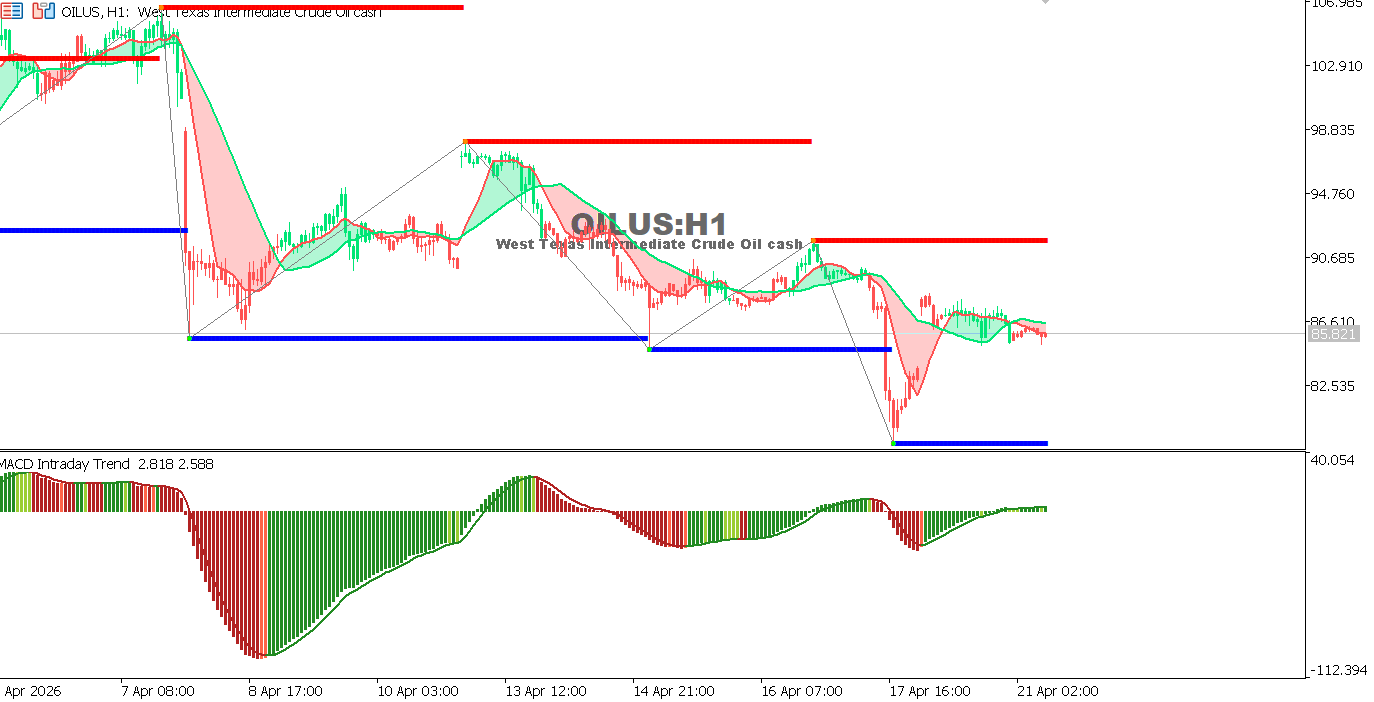
USOIL Hourly Chart
Oil is trading near $85.80 after a clear downward trend, with weak recovery attempts.
The MACD indicator is moving in negative territory, reflecting continued selling pressure.
- Overall Trend: Down
- Support: $82.50 – $80.00
- Resistance: $88.00 – $90.50
Expectation:
A break above $88.00 supports an upward correction, while a break below $82.50 reinforces the downward trend.
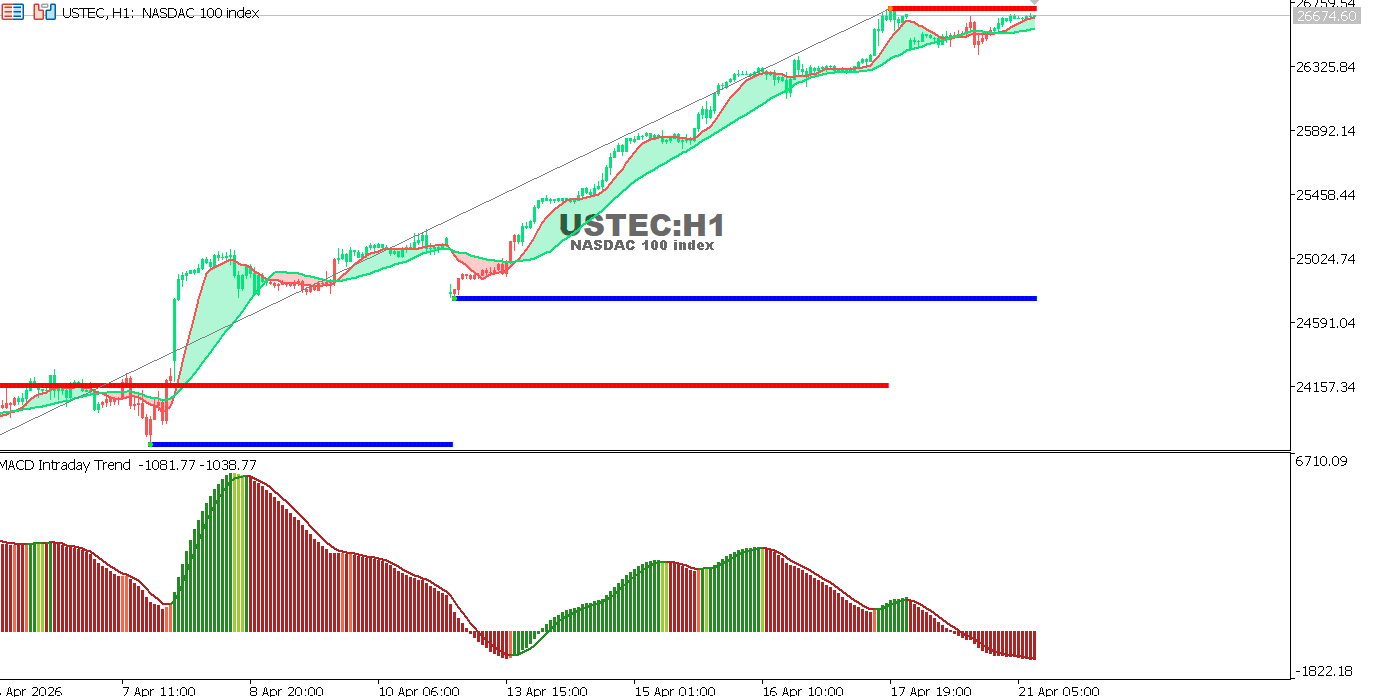
USTEC Hourly Chart
The index is trading near 26,670 after a strong rally, holding near the highs.
The MACD indicator shows a gradual weakening of momentum.
- Overall Trend: Upward
- Support: 25,850 – 24,600
- Resistance: 26,750 – 27,000
Expectation:
A break above the high supports continued upward movement, while a break below 25,850 could trigger a correction.
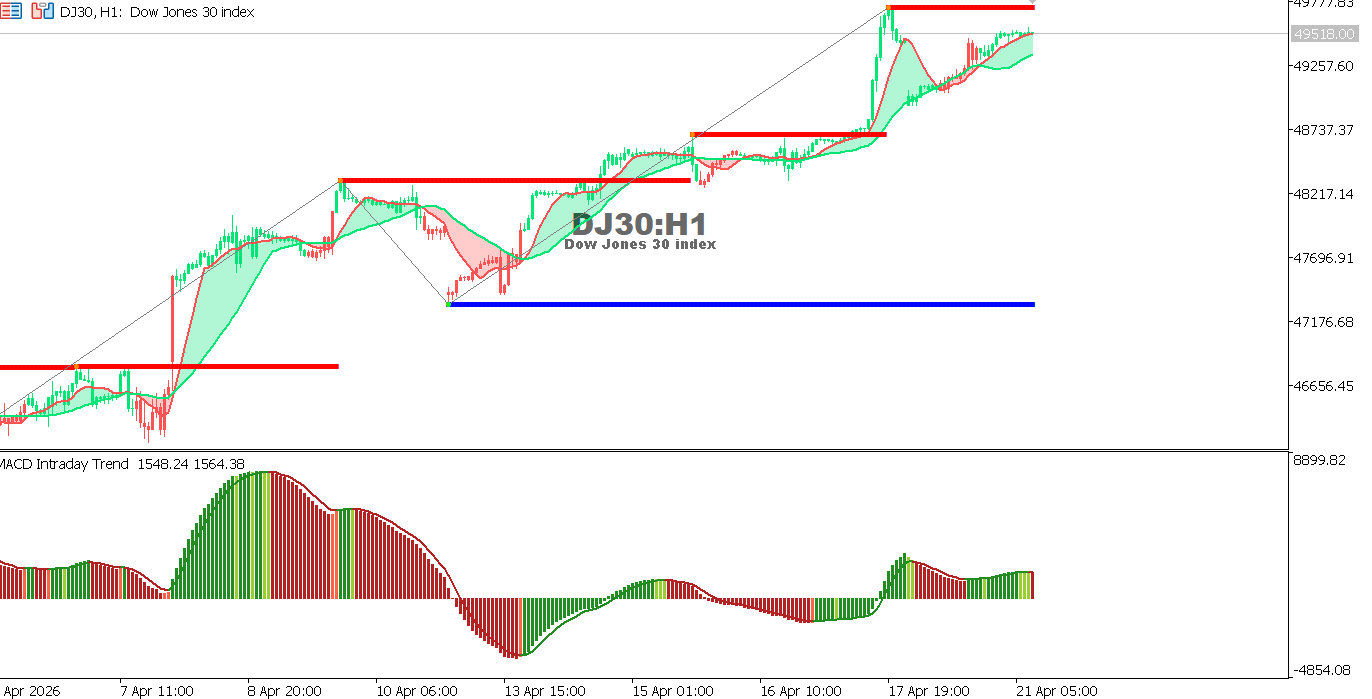
US30 Hourly Chart
The index is trading near 49,500 after a strong rally, stabilizing near the highs.
The MACD indicator suggests a slight weakening of the positive momentum.
- Overall trend: Upward
- Support: 48,750 – 47,200
- Resistance: 49,750 – 50,000
Expectation:
A break above the high supports the continuation of the upward trend, while a break below 48,750 could open the door for a correction.