FXEM - EMPIRE MARKETS - Company New Article
To access the website's classic version and the new accounts, please click here
Apr 20, 2026
Technical analysis of some commodities pairs:
Technical Analysis Report (April 20, 2026):
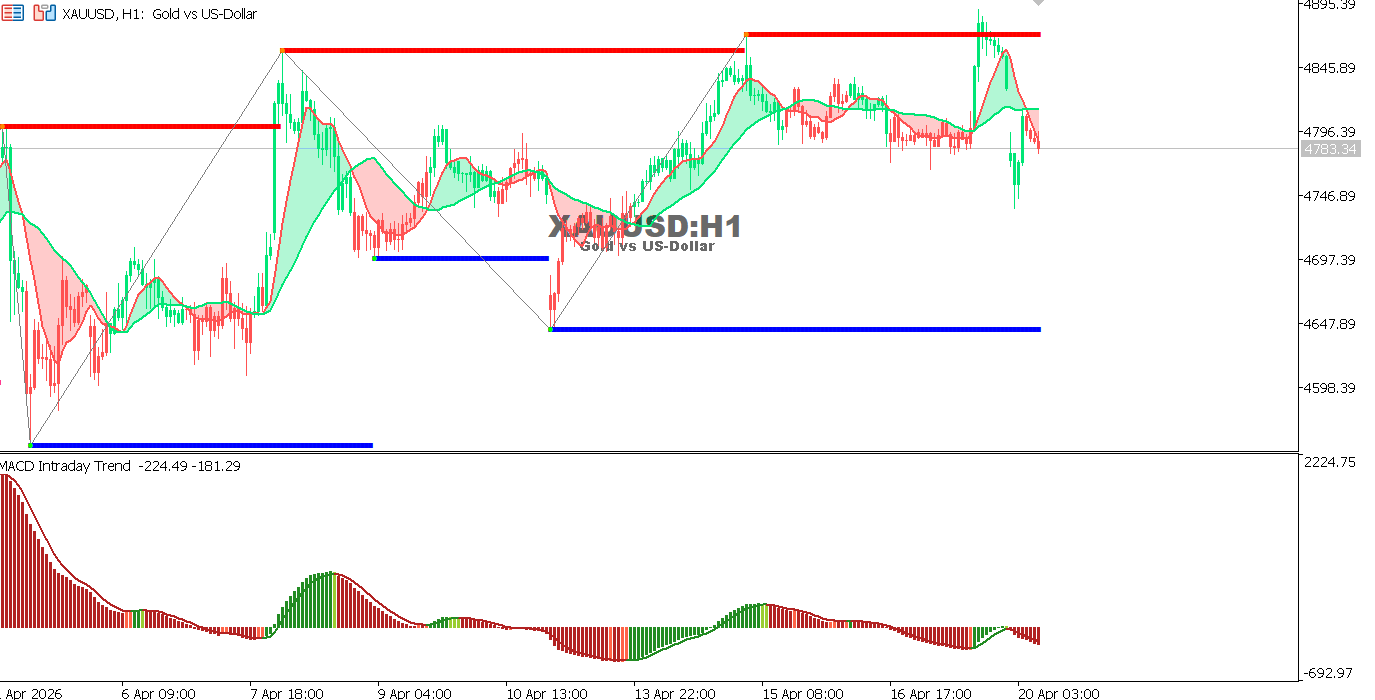
XAUUSD Hourly Chart
Gold is trading near 4780 after a strong rejection from the highs, with noticeable selling pressure.
MACD shows increasing negative momentum.
- General Trend: Bullish (bearish correction)
- Support: 4745 – 4645
- Resistance: 4850 – 4895
Outlook:
A move back above 4850 supports renewed upside, while a break below 4745 may extend the correction.
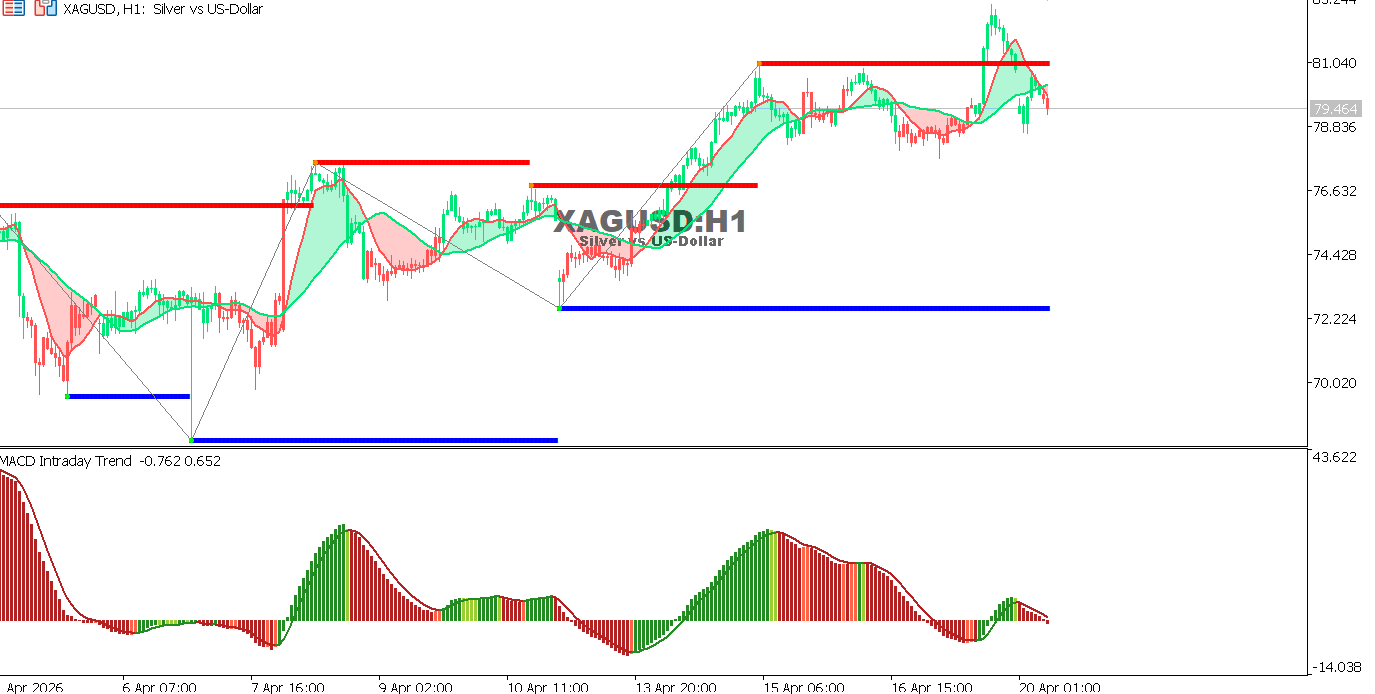
XAGUSD Hourly Chart
Silver is trading near 79.40 after a clear rejection from resistance, with declining momentum.
MACD is in negative territory, reflecting weaker buying pressure.
- General Trend: Bullish (correction phase)
- Support: 78.80 – 72.20
- Resistance: 81.00 – 82.00
Outlook:
A break above 81.00 may resume the uptrend, while a drop below 78.80 supports further downside.
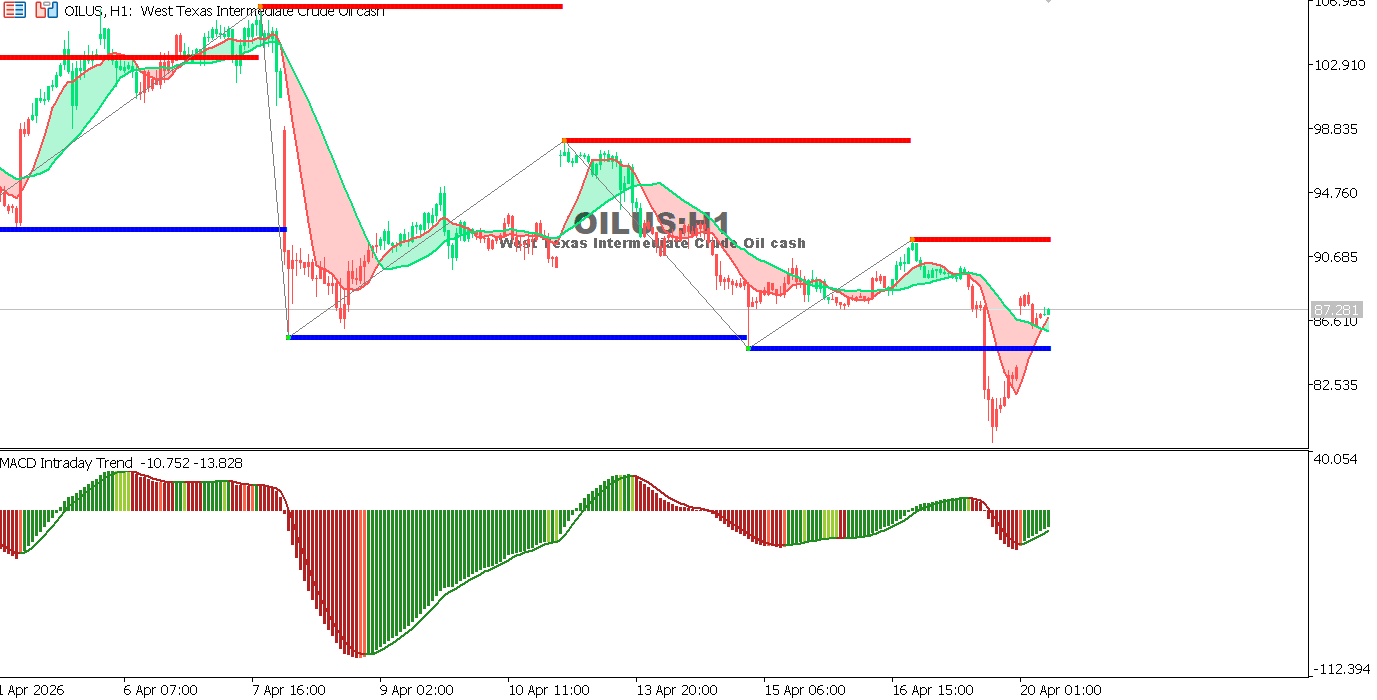
USOIL Hourly Chart
Oil is trading near 87.20 after rebounding from support, attempting to regain momentum.
MACD is improving slightly but has not yet confirmed a strong bullish trend.
- General Trend: Sideways to slightly bullish
- Support: 86.50 – 82.50
- Resistance: 90.50 – 94.80
Outlook:
A break above 90.50 may support further gains, while a move below 86.50 could renew downside pressure.
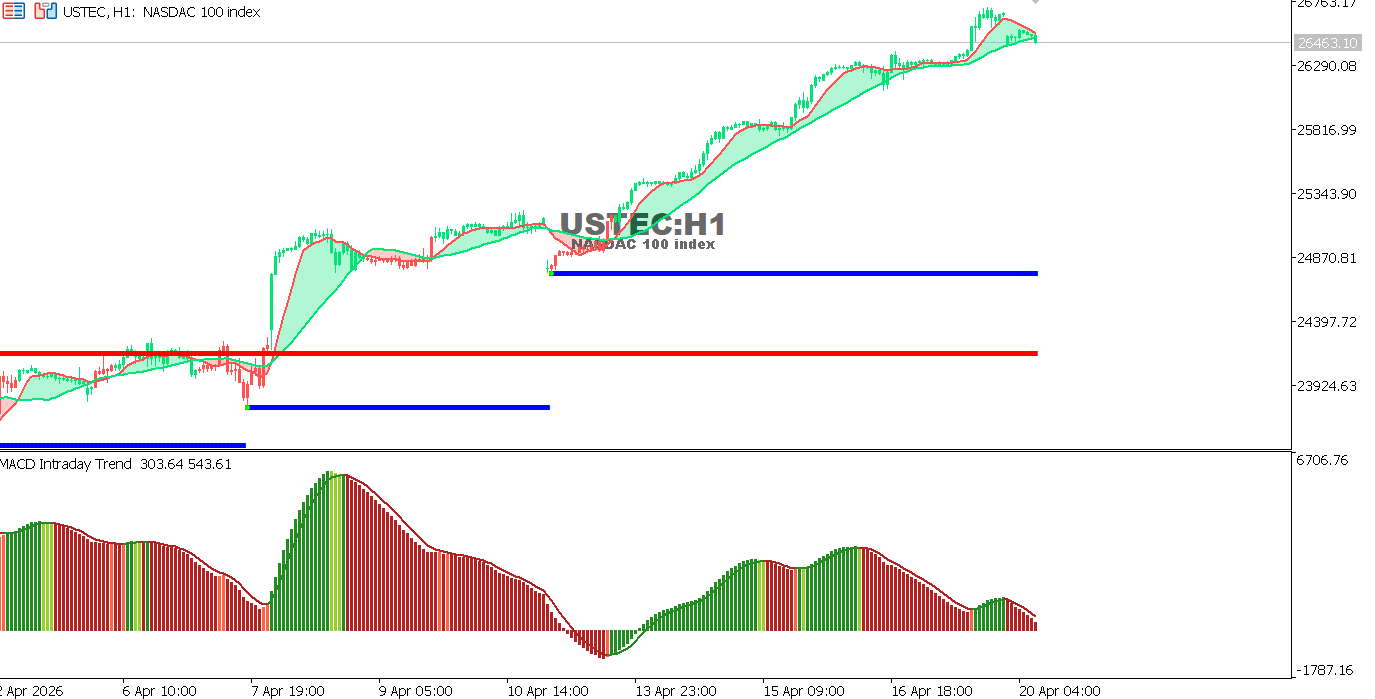
USTEC Hourly Chart
The index is trading near 26460 after a strong rally, with a slight pullback from the peak.
MACD shows gradual weakening in momentum.
- General Trend: Bullish
- Support: 25800 – 24870
- Resistance: 26750 – 27000
Outlook:
A breakout above the recent high supports trend continuation, while a drop below 25800 may open the door for a correction.
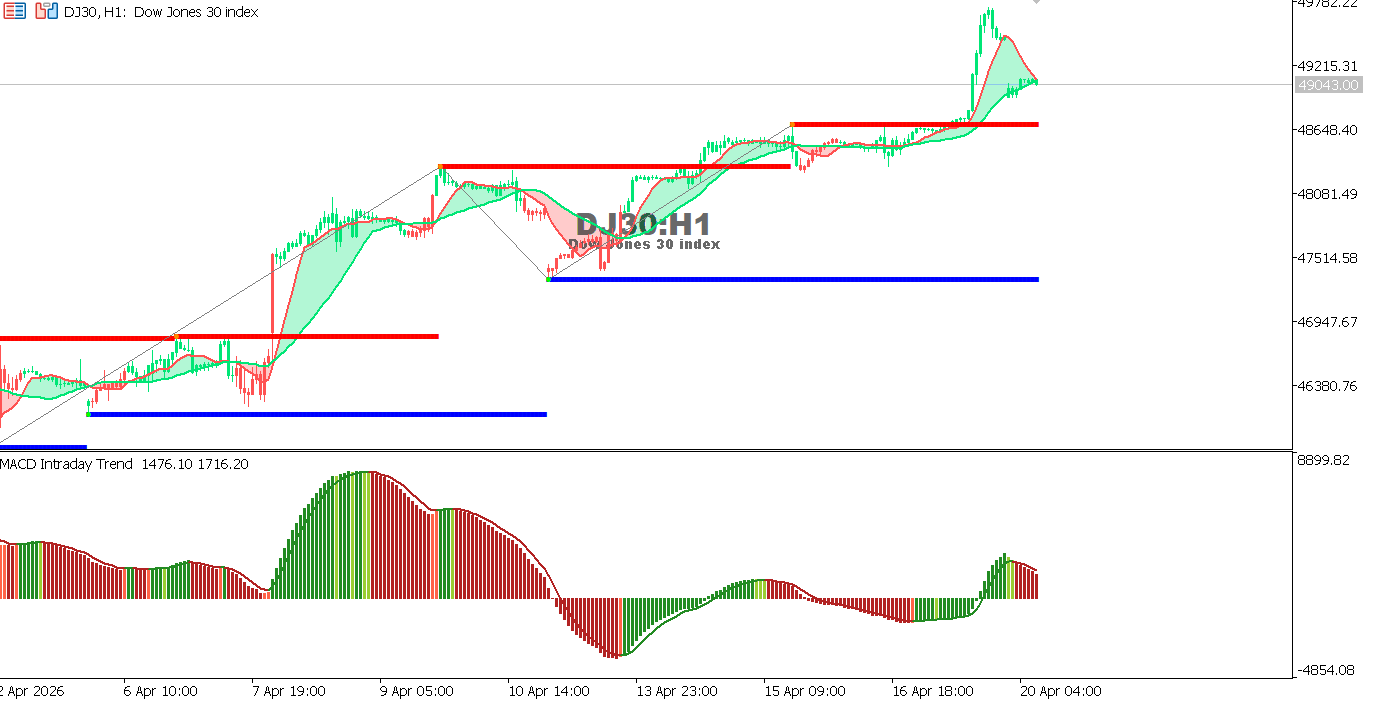
US30 Hourly Chart
The index is trading near 49000 after a strong rally, followed by early signs of consolidation.
MACD indicates fading positive momentum.
- General Trend: Bullish
- Support: 48650 – 47500
- Resistance: 49200 – 49800
Outlook:
A break above the recent high supports further upside, while a drop below 48650 may lead to a deeper correction.