FXEM - EMPIRE MARKETS - Company New Article
To access the website's classic version and the new accounts, please click here
Apr 17, 2026
Technical analysis of some commodities pairs:
Technical Analysis Report (April 17, 2026):
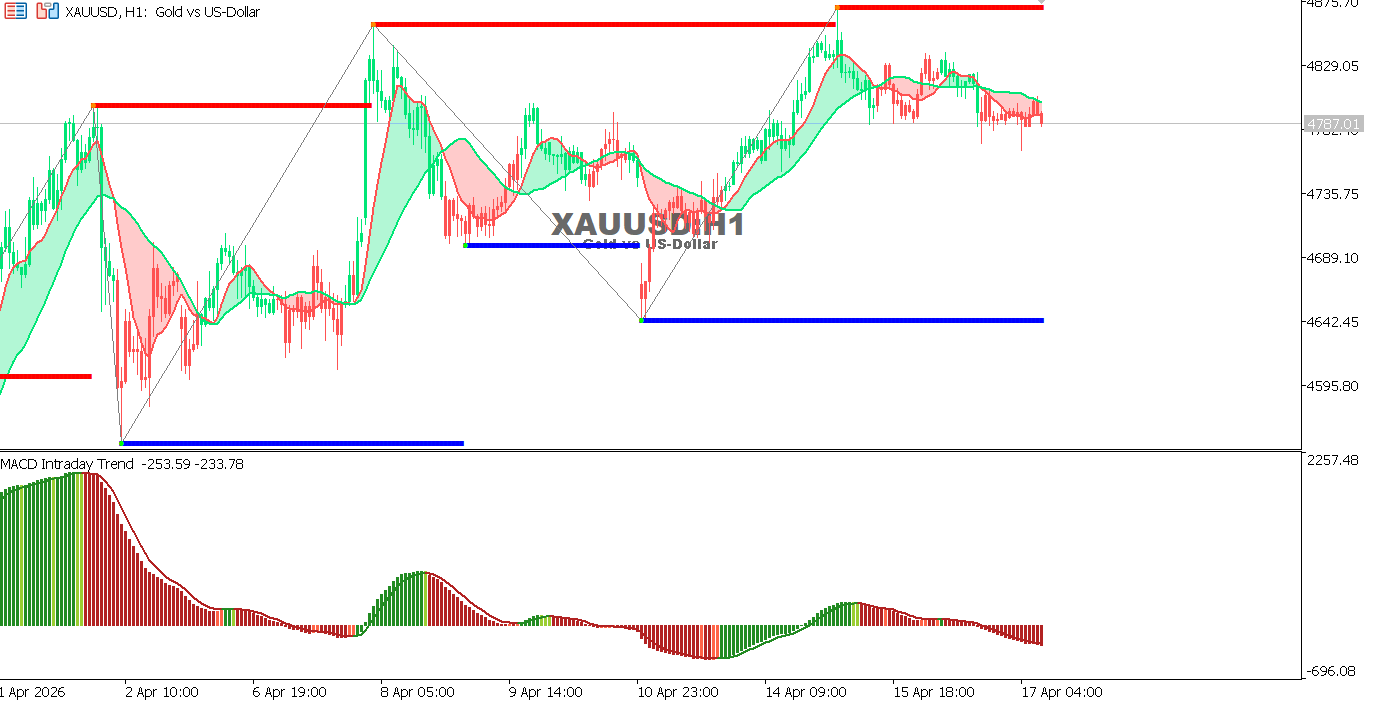
XAUUSD Hourly Chart
Gold is trading near 4780 as the upward trend continues, but it faces strong resistance near the recent high.
The MACD indicator shows a decline in momentum, suggesting a possible correction before the uptrend resumes.
- Overall trend: Upward
- Support: 4750 – 4680
- Resistance: 4850 – 4900
Expectation: Holding above 4750 supports the continuation of the uptrend, while failure to break above 4850 could lead to a temporary correction.
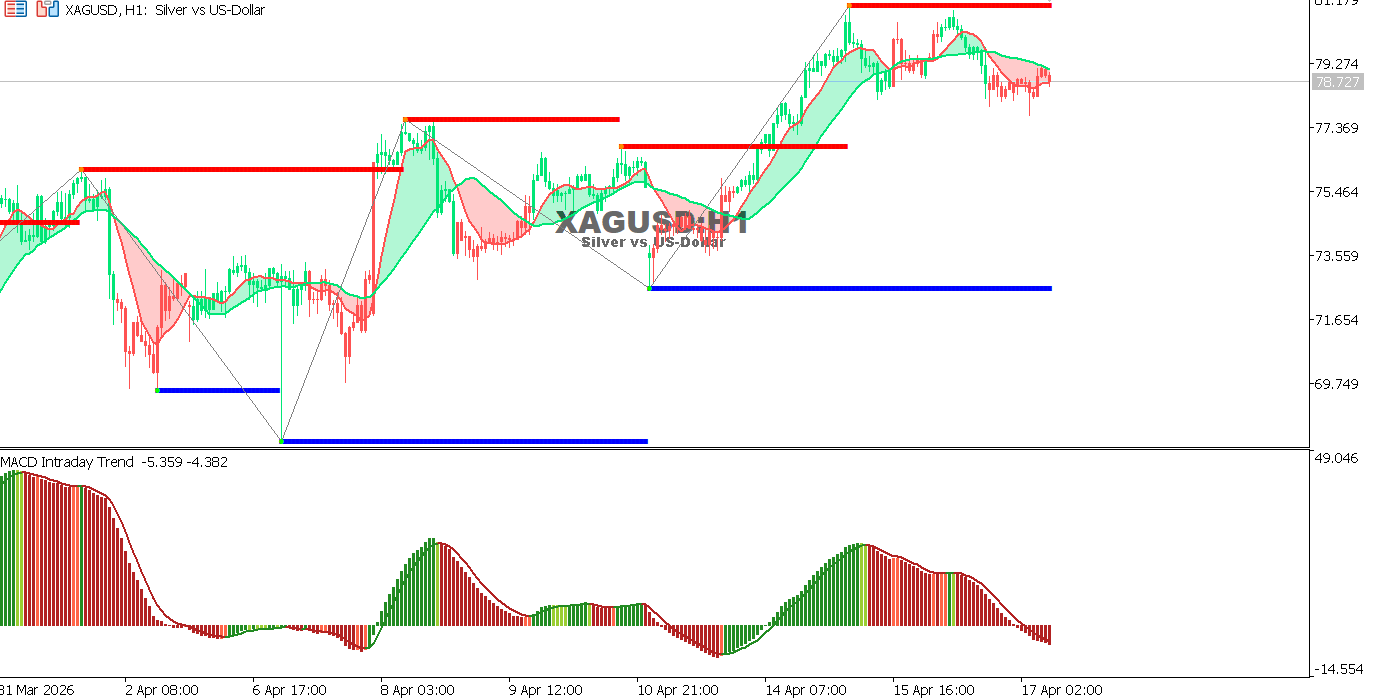
XAGUSD Hourly Chart
Silver is trading near 78.70 after pulling back from the high, with the overall uptrend continuing.
The MACD indicator shows weak momentum, reflecting the possibility of a continuation of the corrective move.
- Overall trend: Upward
- Support: 77.00 – 75.50
- Resistance: 80.00 – 81.00
Expectation: Holding above 77 supports the upside, while a break below it could open the door for further declines.
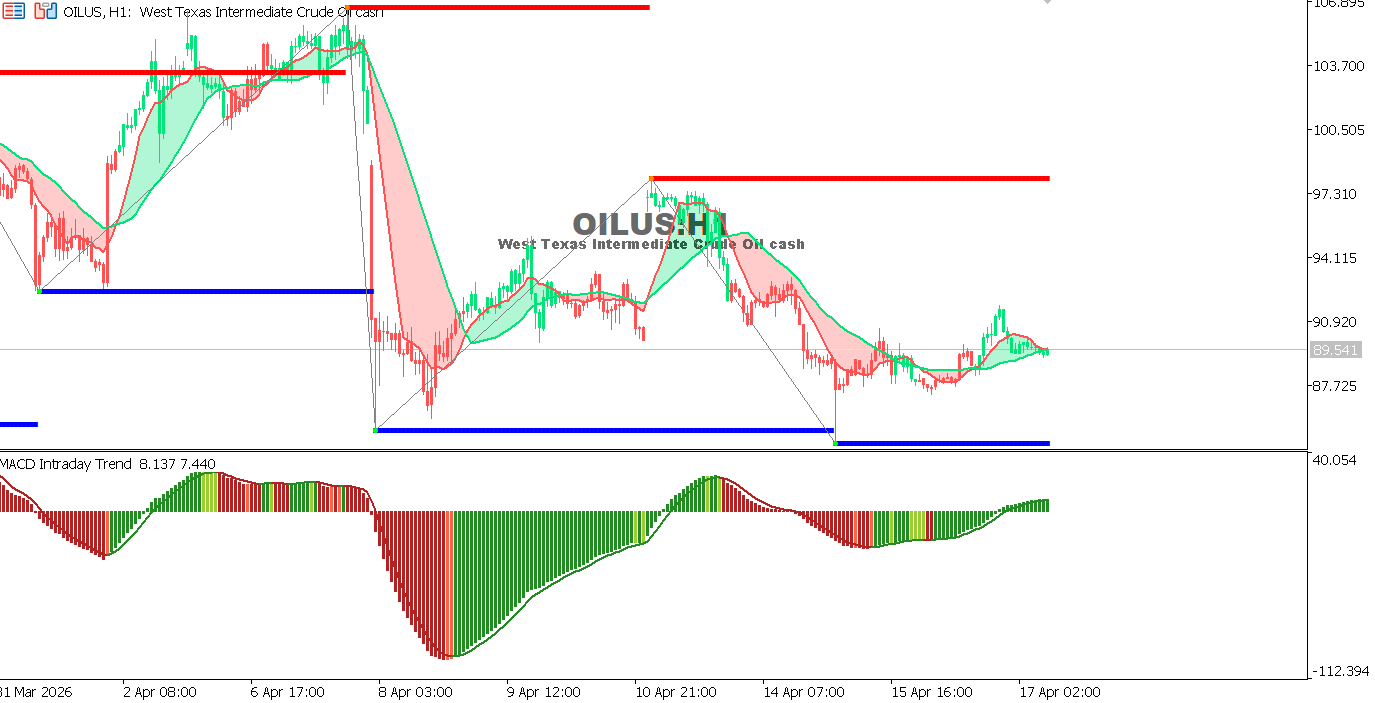
USOIL Hourly Chart
Oil is trading near 89.50, attempting a recovery after a strong downtrend, but remains under pressure.
The MACD indicator shows a slight improvement in momentum, suggesting the possibility of a limited upward correction.
- Overall Trend: Down
- Support: 87.50 – 85.00
- Resistance: 92.50 – 97.00
Expectation: A break above 92.50 could support further recovery, while failure would reinstate the downtrend.
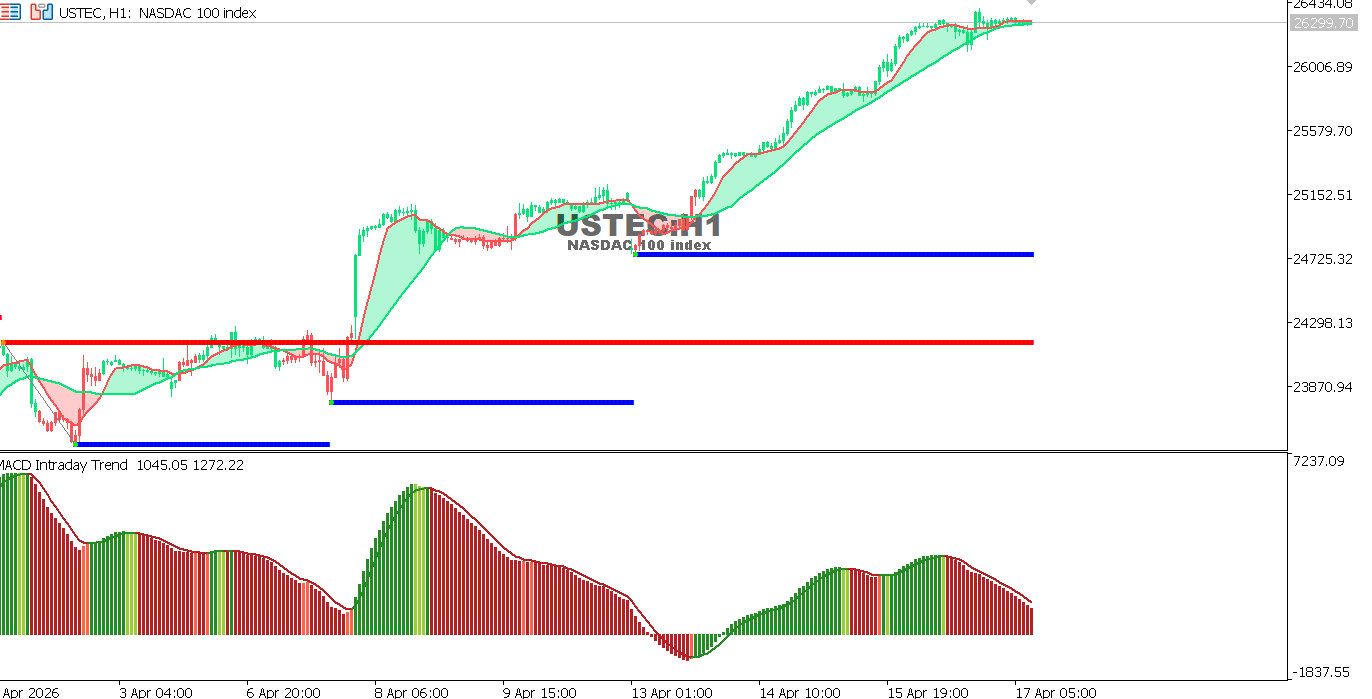
USTEC Hourly Chart
The index is trading near 26,300 with a continued strong upward trend.
The MACD indicator shows a decline in positive momentum, suggesting a potential pullback or correction.
- Overall Trend: Upward
- Support: 26,000 – 25,500
- Resistance: 26,500 – 26,800
Expectation: A break above 26,500 supports continued upward movement, while a failure could lead to a temporary correction.
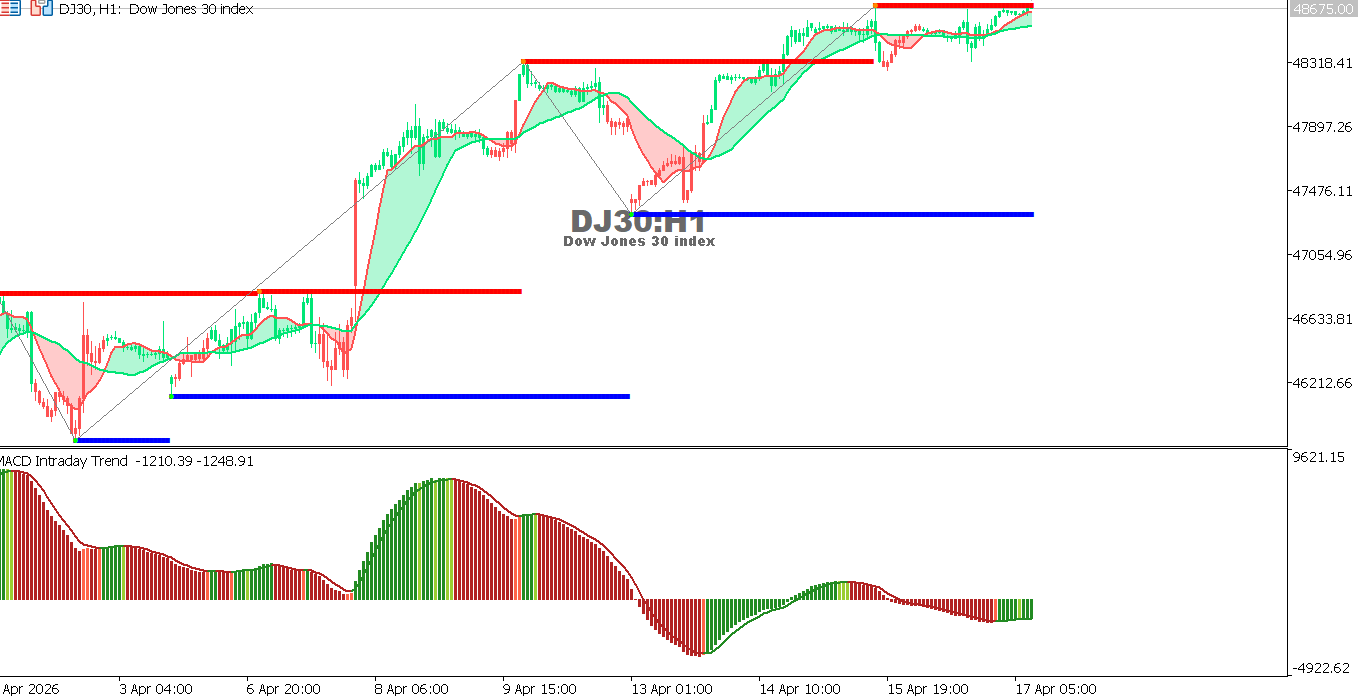
US30 Hourly Chart
The index is trading near 48,600, continuing its upward trend close to historical highs.
The MACD indicator shows weakening momentum, suggesting a potential slowdown or correction.
- Overall trend: Upward
- Support: 48,000 – 47,400
- Resistance: 48,700 – 49,000
Expectation: Holding above 48,000 supports the upward move, while a break below this level could trigger a short-term correction.