FXEM - EMPIRE MARKETS - Company New Article
To access the website's classic version and the new accounts, please click here
Apr 16, 2026
Technical analysis of some commodities pairs:
Technical Analysis Report (April 16, 2026):
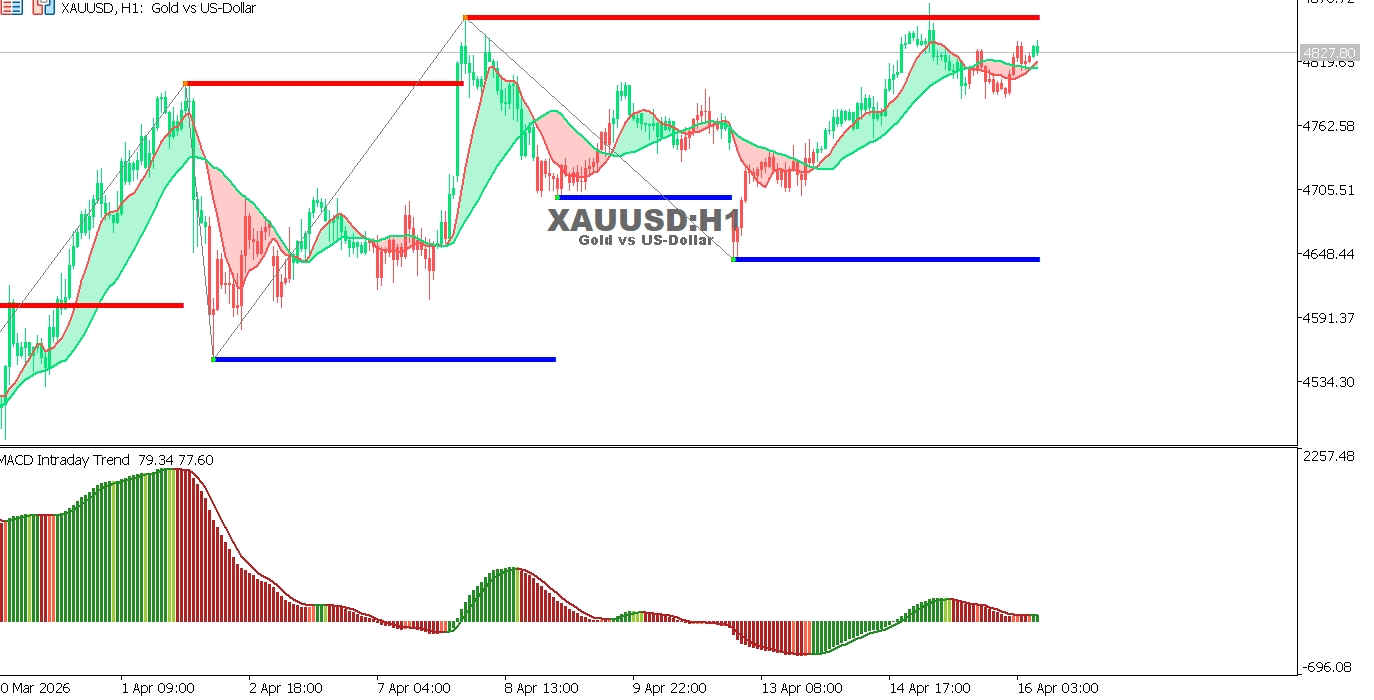
XAUUSD Hourly Chart
Gold is trading near 4827 in a slightly bullish sideways movement near key resistance levels.
MACD shows weak positive momentum, indicating a lack of strong breakout pressure so far.
- Overall trend: Slightly bullish / sideways
- Support: 4760 – 4705
- Resistance: 4835 – 4875
Outlook:
A break above 4835 may open the way for further gains, while failure could lead to a temporary pullback.
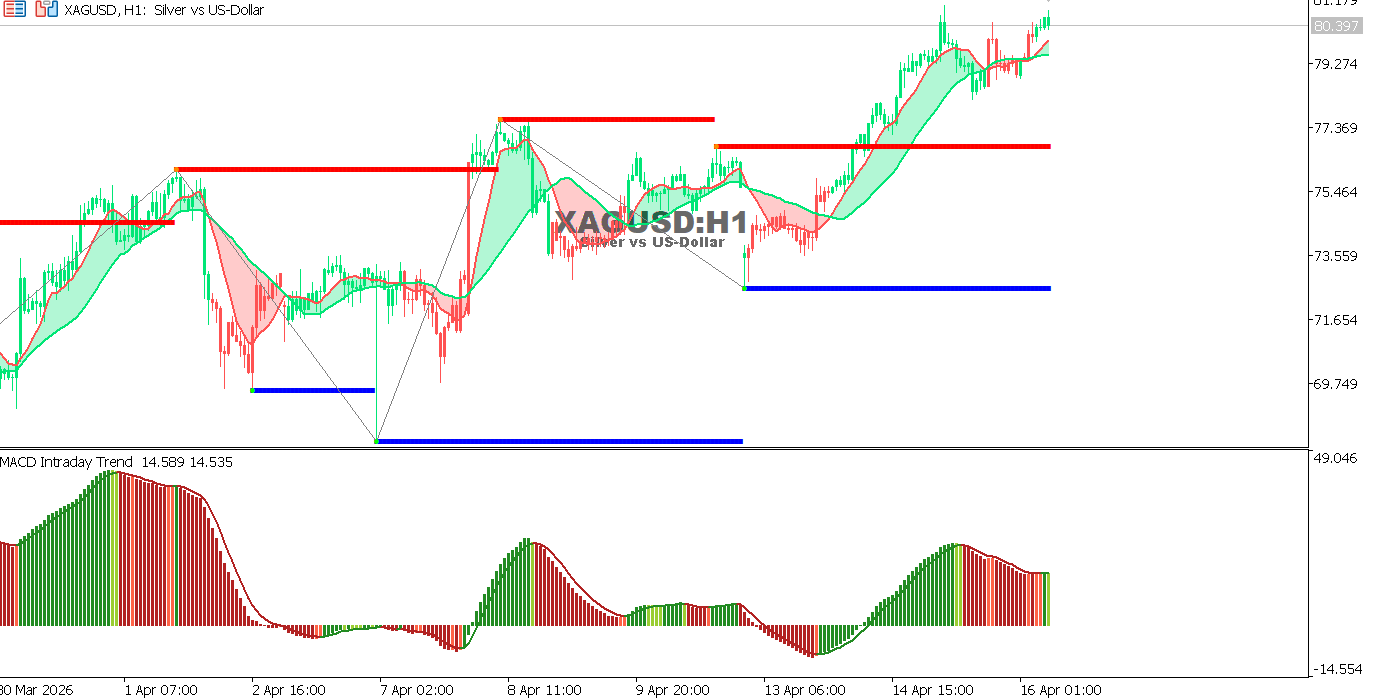
XAGUSD Hourly Chart
Silver is trading near 80.30 after breaking previous resistance levels, maintaining a bullish trend.
MACD shows positive momentum with signs of stabilization, suggesting potential consolidation before continuation.
- Overall trend: Bullish
- Support: 79.20 – 77.30
- Resistance: 81.00 – 82.50
Outlook:
Holding above 79.20 supports further upside, while a break below may lead to a correction.
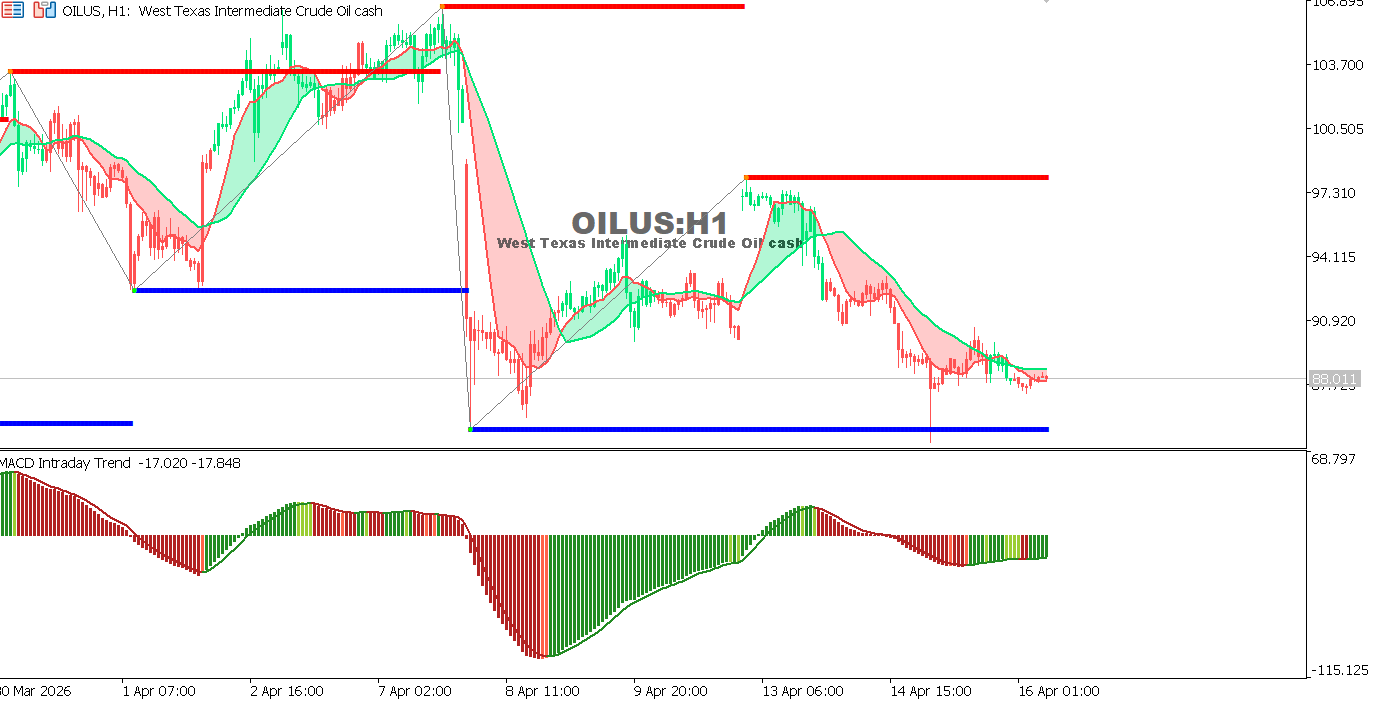
USOIL Hourly Chart
Oil is trading near 88.00 following a clear downtrend, with limited recovery attempts.
MACD shows weakening bearish momentum as negative bars shrink, suggesting a possible corrective rebound.
- Overall trend: Bearish
- Support: 87.70 – 87.00
- Resistance: 90.90 – 97.30
Outlook:
Staying below 90.90 keeps bearish pressure intact, while a break above may support a stronger recovery.
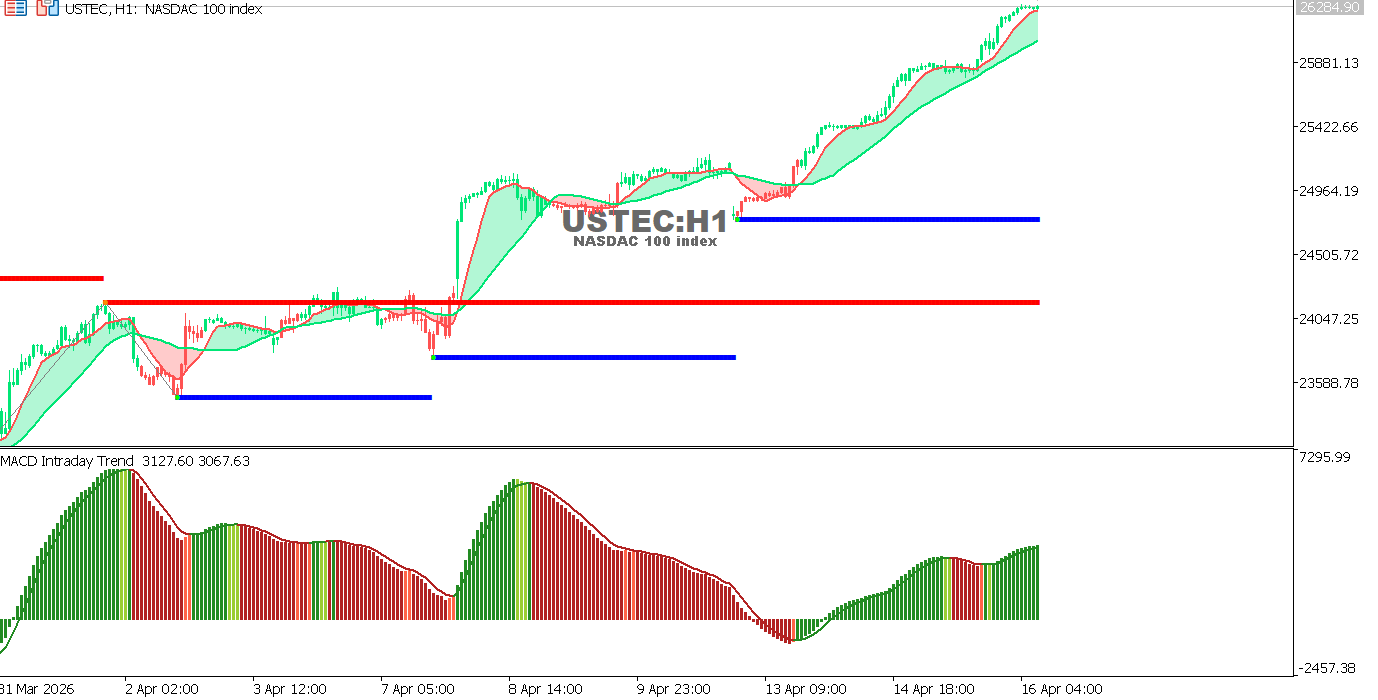
USTEC Hourly Chart
The index is trading near 26280 within a strong uptrend, continuing to print higher highs.
MACD reflects increasing bullish momentum, supporting further upside.
- Overall trend: Bullish
- Support: 25880 – 24960
- Resistance: 26350 – 26600
Outlook:
Holding above 25880 supports continued gains, with possible short-term slowdown due to overbought conditions.
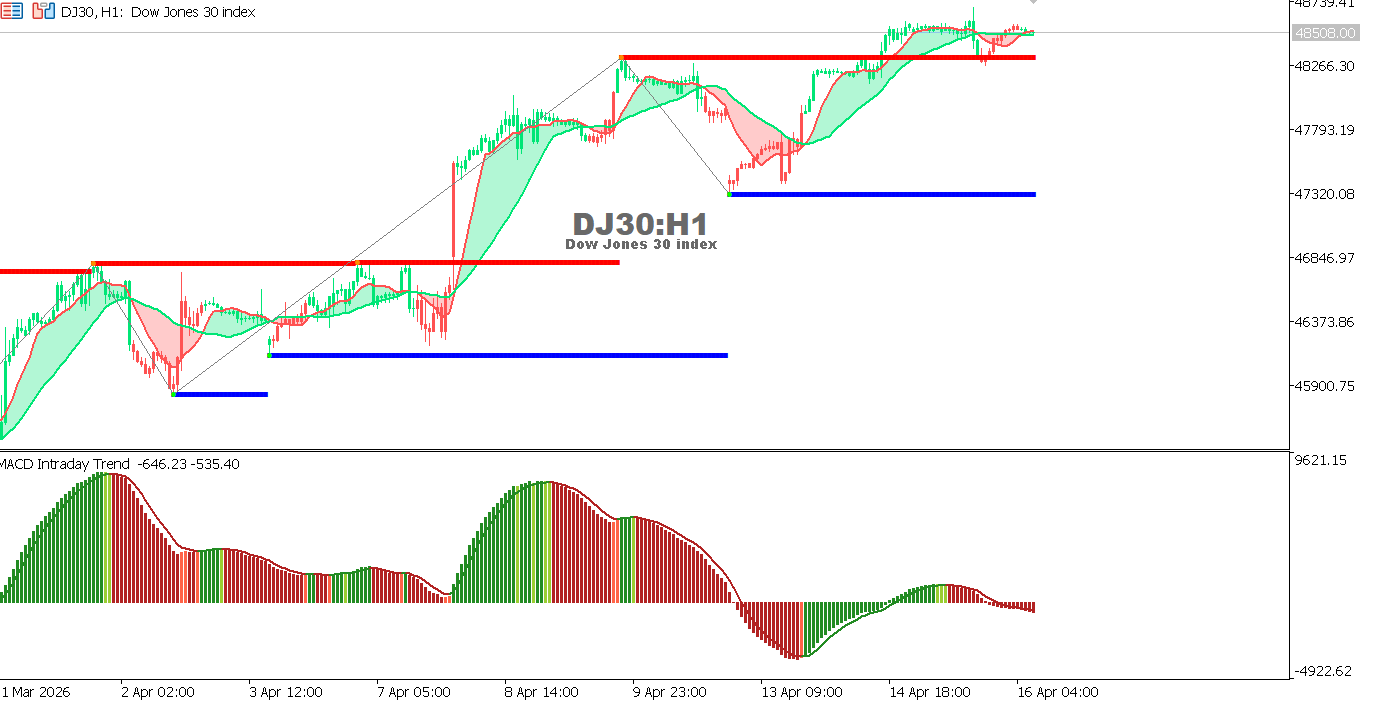
US30 Hourly Chart
The index is trading near 48500 after a strong rally, currently moving in a sideways range.
MACD shows fading momentum, indicating a potential correction or continued consolidation.
- Overall trend: Bullish with consolidation
- Support: 48250 – 47320
- Resistance: 48650 – 49000
Outlook:
A break below 48250 may open the door for a deeper correction, while holding above supports consolidation.