FXEM - EMPIRE MARKETS - Company New Article
To access the website's classic version and the new accounts, please click here
Jun 20, 2025
 |
|
|
 |
||
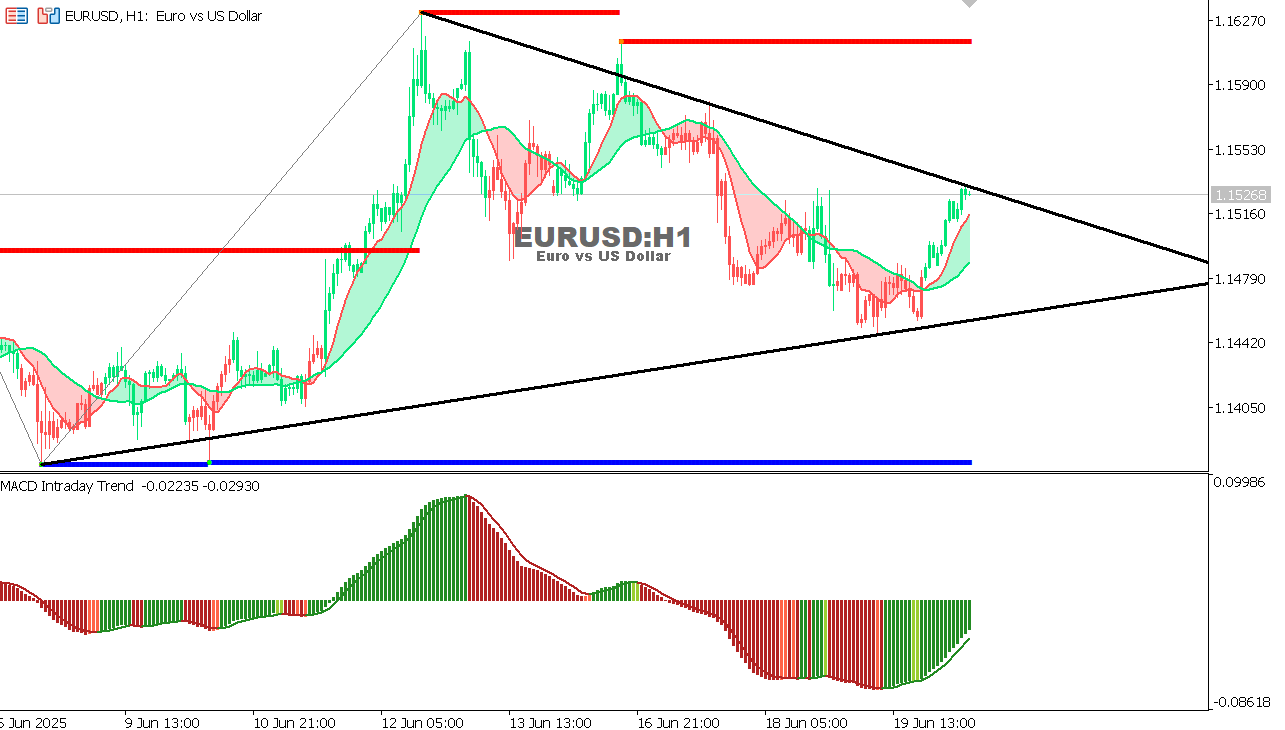
EUR/USD Chart on the hourtly time frameAs we predicted yesterday, continued consolidation above the trend line supports the possibility of a rise towards 1.1525, and the target has already been achieved.
Expectation: If the 1.1550 resistance is broken, we may witness an acceleration towards 1.1590. A negative break below 1.1480 could return the pair to the 1.1440 levels.
|