FXEM - EMPIRE MARKETS - Company New Article
To access the website's classic version and the new accounts, please click here
Nov 07, 2025
 |
|
|
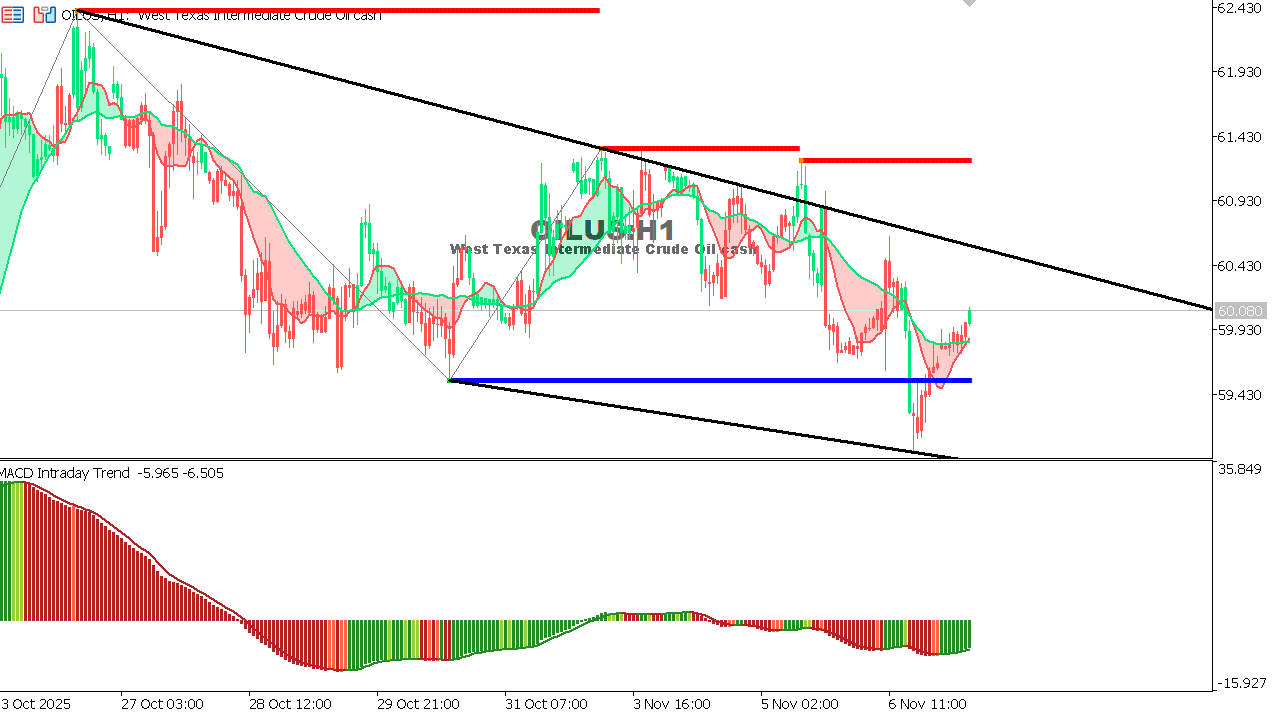 |
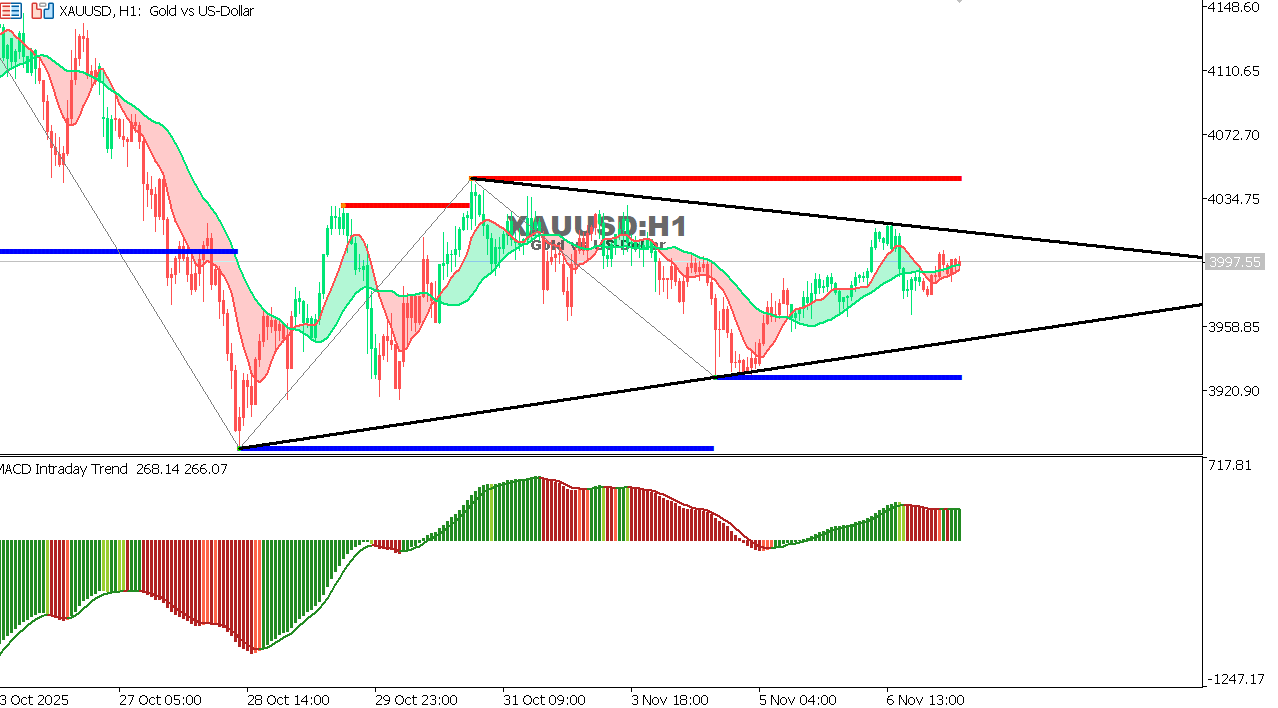
USOIL Chart on the hourtly time frameOverall Trend: Correctively bullish after a sharp downward move. Indicators:
Reasons:
Expectation:
|
 |
|
|
 |
|
|