FXEM - EMPIRE MARKETS - Company New Article
To access the website's classic version and the new accounts, please click here
Oct 30, 2025
 |
|
|
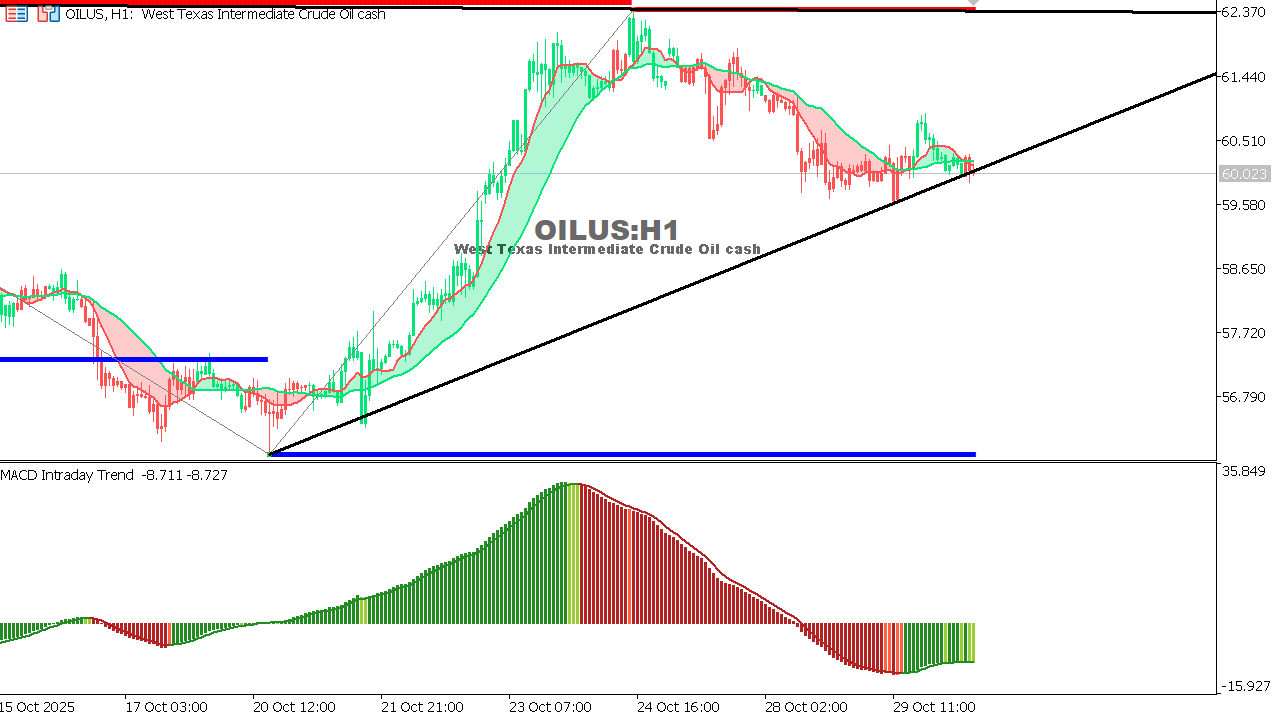 |
USOIL Chart on the hourtly time frameOverall trend: Strongly bearish after breaking support at 61.20. Reasons:
|
 |
|
|
 |
|
|