FXEM - EMPIRE MARKETS - Company New Article
To access the website's classic version and the new accounts, please click here
Oct 29, 2025
 |
|
|
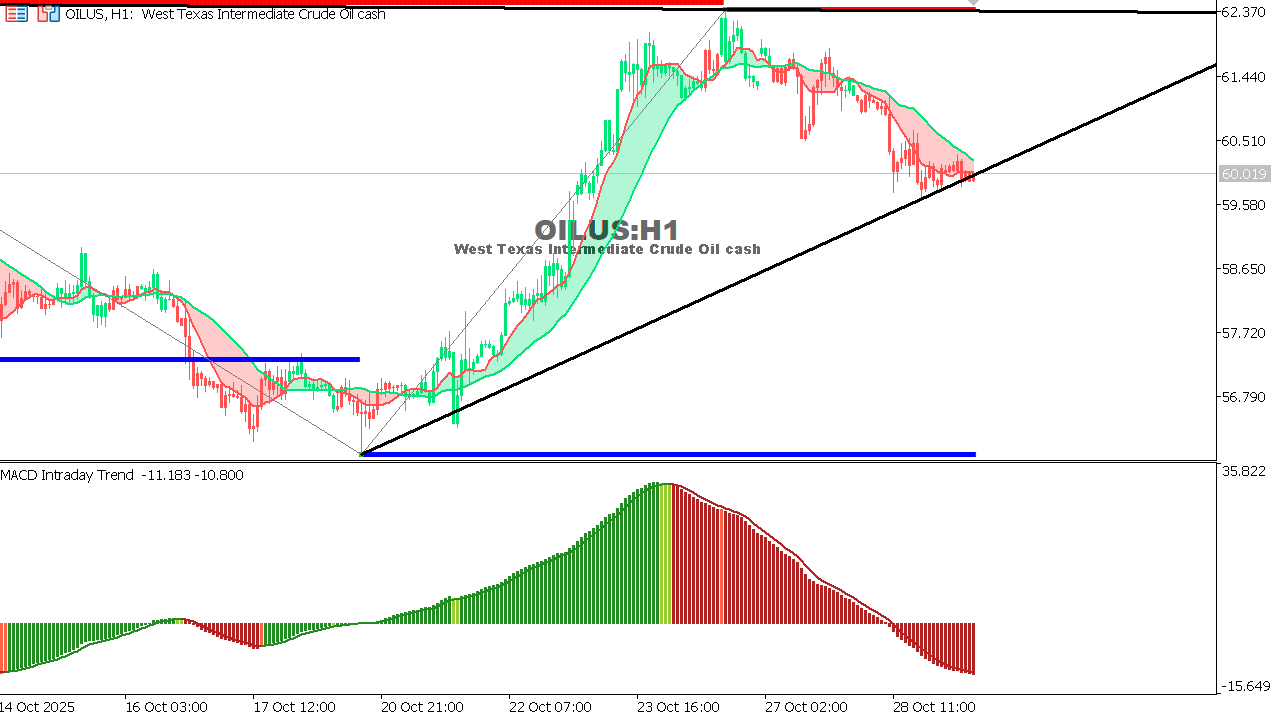 |
USOIL Chart on the hourtly time frameOverall Trend: Sideways with a slight upward bias after sharp declines. Reasons: Expectation:
|
 |
|
|
 |
|
|