FXEM - EMPIRE MARKETS - Company New Article
To access the website's classic version and the new accounts, please click here
Jan 02, 2026
 |
|
|
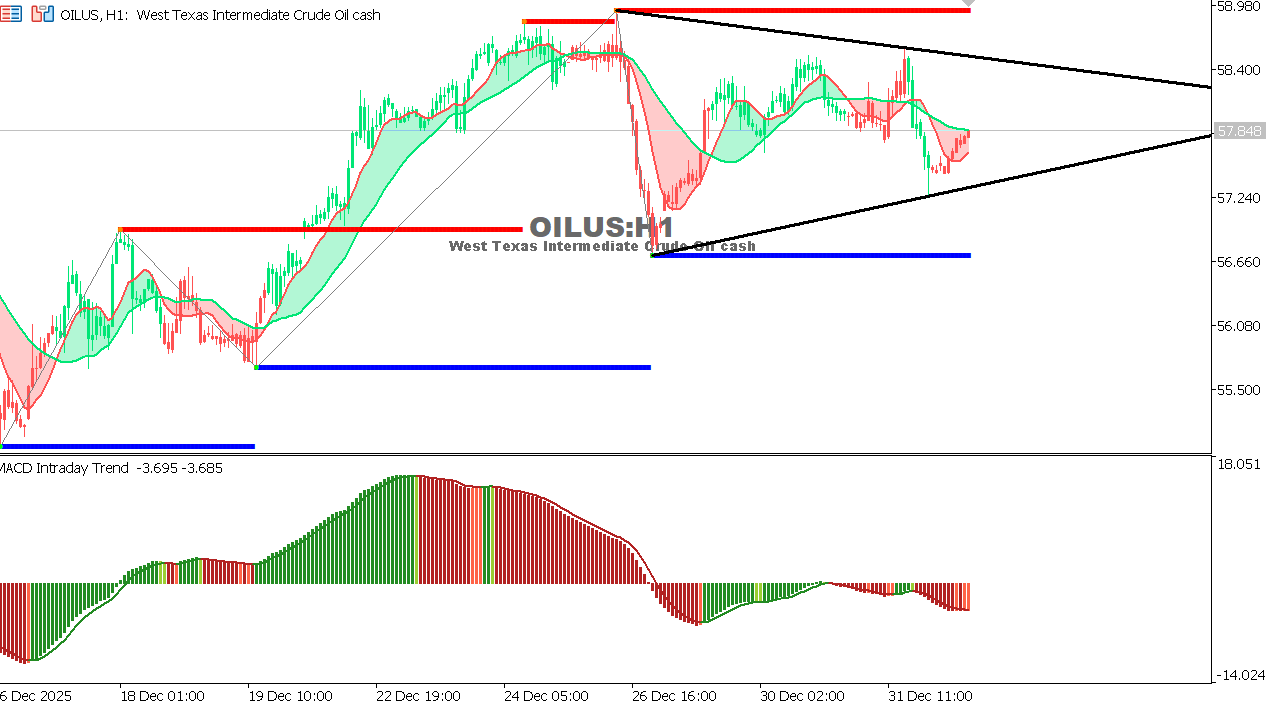 |
USOIL Chart on the hourly time frameOil is trading in a narrow range near $58 amid a balance between global demand concerns and supply cut expectations. Momentum is relatively weak, with a tendency towards sideways movement in the absence of strong catalysts. Overall Trend: Sideways with a downward bias Expectation: Continued volatility unless new fundamental factors emerge. |
 |
|
|
 |
|
|