FXEM - EMPIRE MARKETS - Company New Article
To access the website's classic version and the new accounts, please click here
Dec 31, 2025
 |
|
|
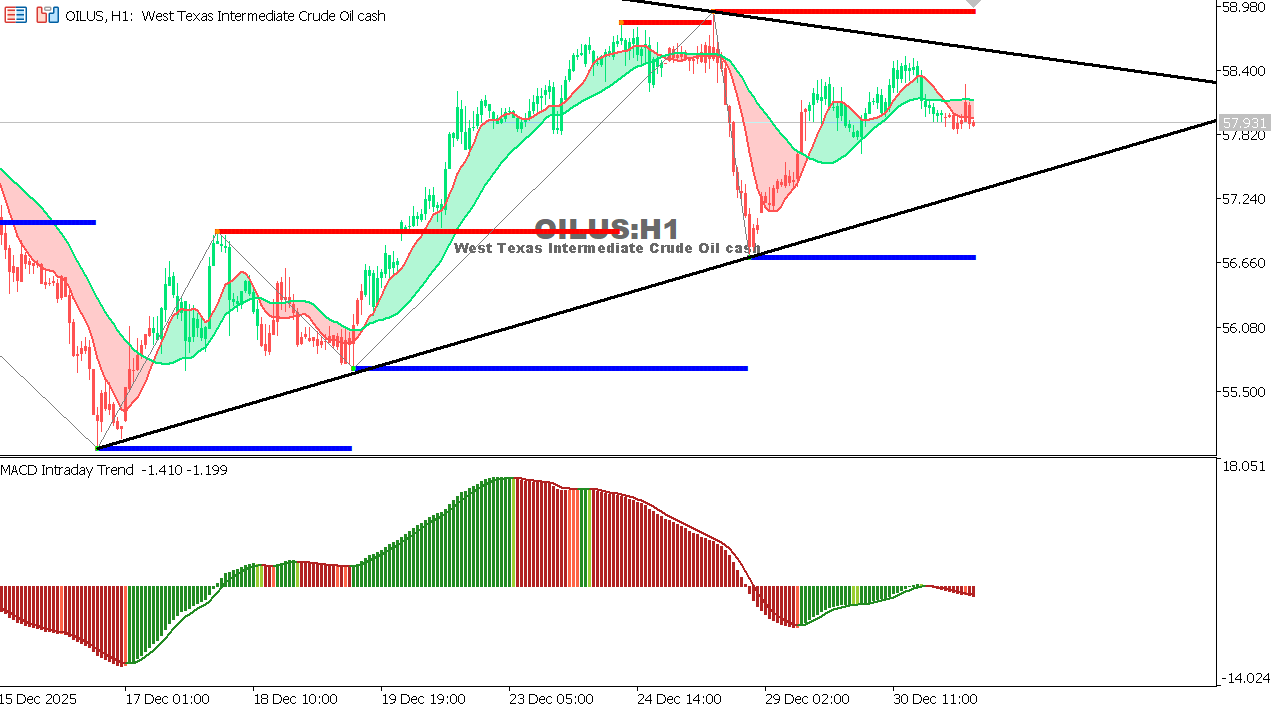 |
USOIL Chart on the hourly time frameOil is trading in a narrow range near key support levels, with year-end caution and thin trading volumes persisting. The current movement reflects a balance between global demand concerns and attempts at a technical recovery from recent lows. The MACD indicator remains negative but shows a slowdown in downward momentum, which could pave the way for a limited corrective move. Overall Trend: Neutral-Bearish Expectation: Holding above 57.20 could support a limited rebound, while a break below this level would bring renewed pressure towards 56.50. |
 |
|
|
 |
|
|