FXEM - EMPIRE MARKETS - Company New Article
To access the website's classic version and the new accounts, please click here
Jan 12, 2026
 |
|
|
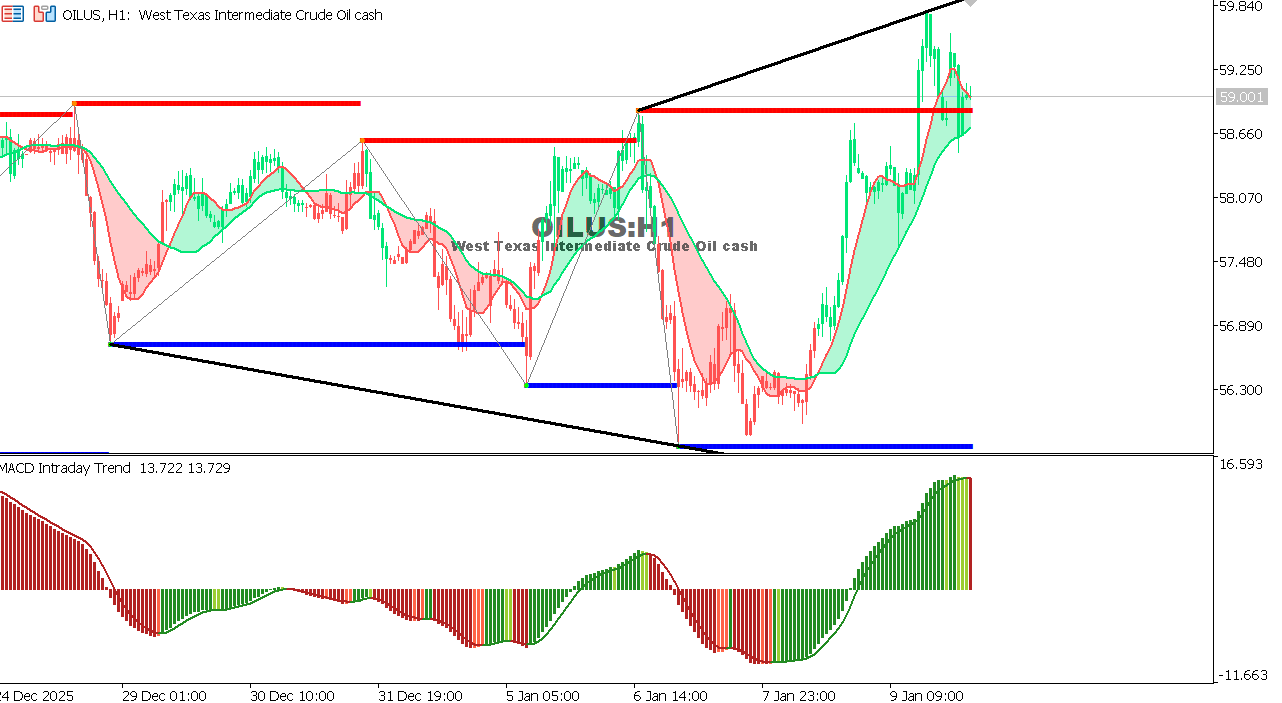 |
USOIL Chart on the hourly time frameOil is trading near lows within a clear sideways range, with weak momentum and a lack of a strong trend. Recovery attempts remain limited, under continued technical pressure below nearby resistance levels. Overall Trend: Sideways with a downward bias Expectation: Stability above 49.20 could allow for limited upward movement, while a break below this level would bring downward pressure back. |
 |
|
|
 |
|
|