FXEM - EMPIRE MARKETS - Company New Article
To access the website's classic version and the new accounts, please click here
Jan 09, 2026
 |
|
|
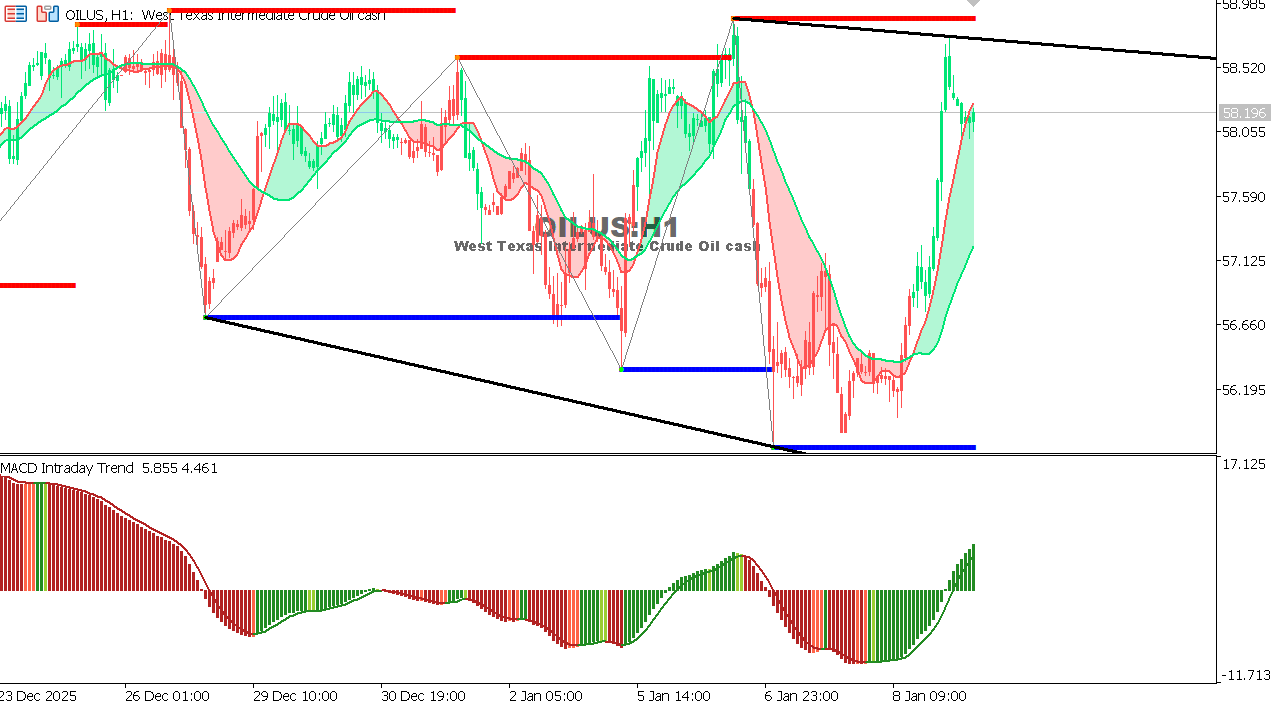 |
USOIL Chart on the hourly time frameOil is moving sideways with a downward bias after a previous pullback, with limited attempts to stabilize above psychological support levels. Weak momentum reflects a wait-and-see approach in the markets amid a balance between demand concerns and supply expectations. Overall Trend: Neutral with a downward bias Expectation: A break below 57.40 could bring back selling pressure, while a break above 59.30 could support a limited upward correction. |
 |
|
|
 |
|
|