FXEM - EMPIRE MARKETS - Company New Article
To access the website's classic version and the new accounts, please click here
Feb 09, 2026
 |
|
|
 |
|
|
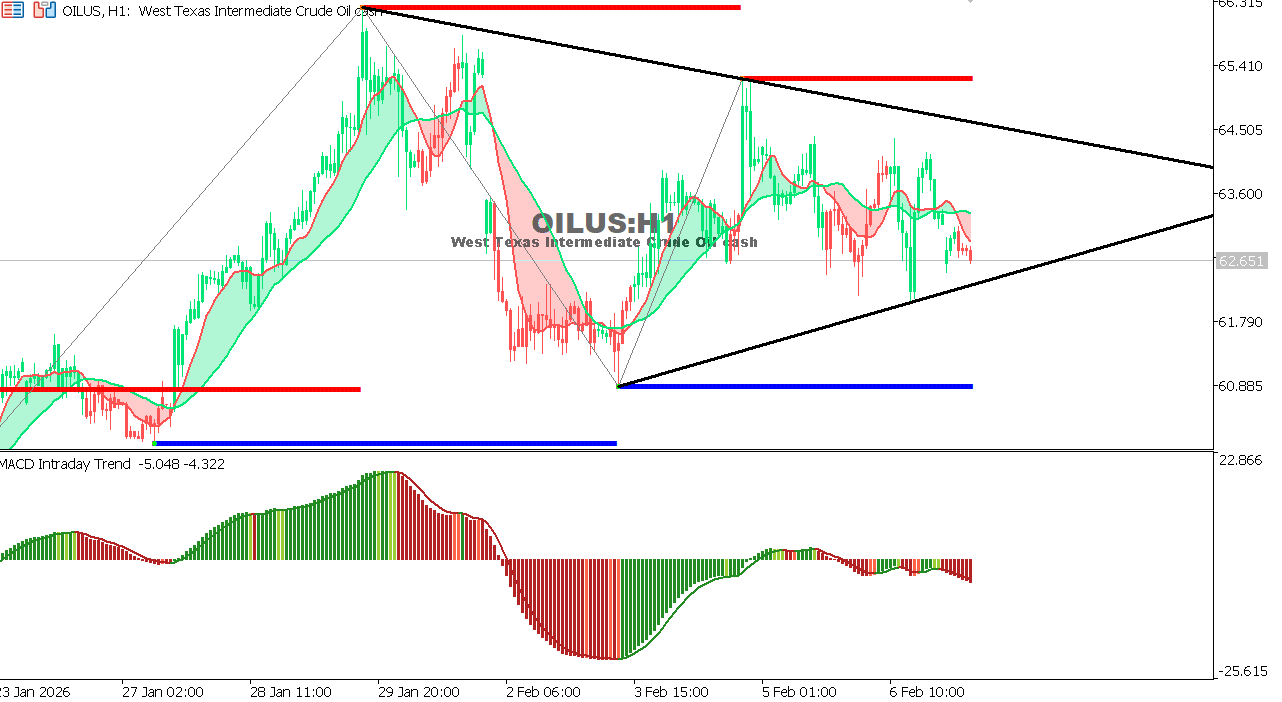 |
USOIL Chart on the hourly time frameCrude oil is attempting to consolidate above a key technical support level after a previous downward move, amid market anticipation of global supply and demand factors. Momentum remains relatively weak, but signs of stabilization are beginning to emerge. General Trend: Neutral Expectation: A break above 64.10 could trigger a broader recovery, while a break below 61.20 would reinstate the bearish scenario.
|
 |
|
|
 |
|
|