FXEM - EMPIRE MARKETS - Company New Article
To access the website's classic version and the new accounts, please click here
Feb 06, 2026
 |
|
|
 |
|
|
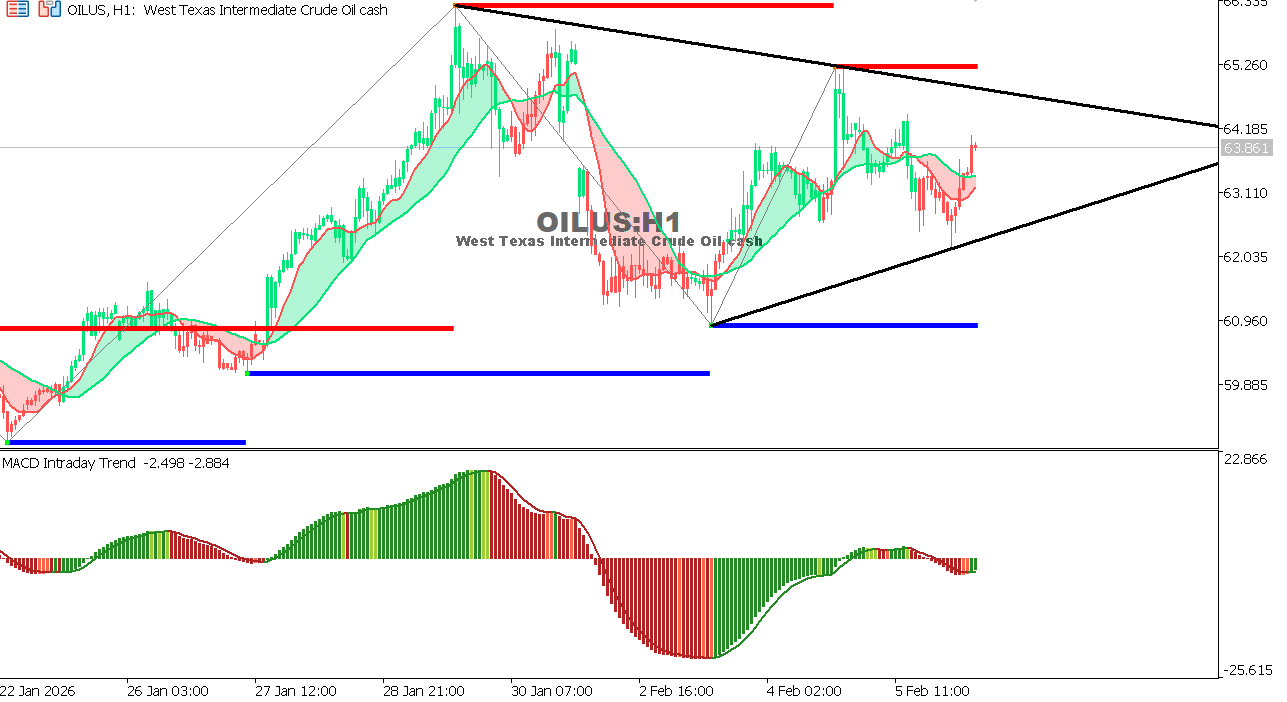 |
USOIL Chart on the hourly time frameOil is moving sideways with a clear lack of momentum, in the absence of strong catalysts to drive a clear direction. Overall trend: Sideways Expectation: Trading below 65.20 keeps the movement limited, and only a break above this level could open the way for a broader upward surge.
|
 |
|
|
 |
|
|