FXEM - EMPIRE MARKETS - Company New Article
To access the website's classic version and the new accounts, please click here
Feb 05, 2026
 |
|
|
 |
|
|
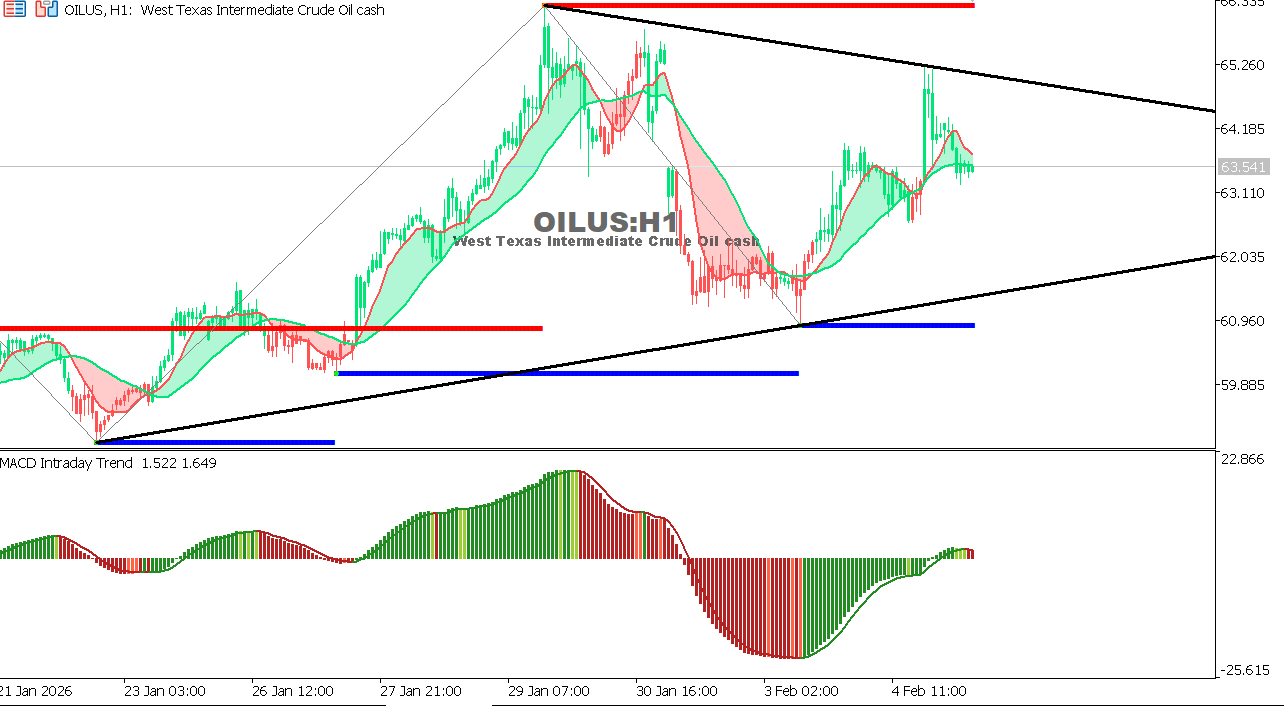 |
USOIL Chart on the hourly time frameOil continues to trade within a weak, sideways range, lacking strong fundamental catalysts to support an upward trend. Current movements reflect market hesitancy, balanced between concerns about global demand and attempts to stabilize prices. Technical momentum remains limited, making short-term movements susceptible to volatility. Overall Trend: Neutral Expectation: A break above 64.60 could support a limited rebound, while a break below 62.80 would reinstate negative pressure.
|
 |
|
|
 |
|
|