FXEM - EMPIRE MARKETS - Company New Article
To access the website's classic version and the new accounts, please click here
Feb 04, 2026
 |
|
|
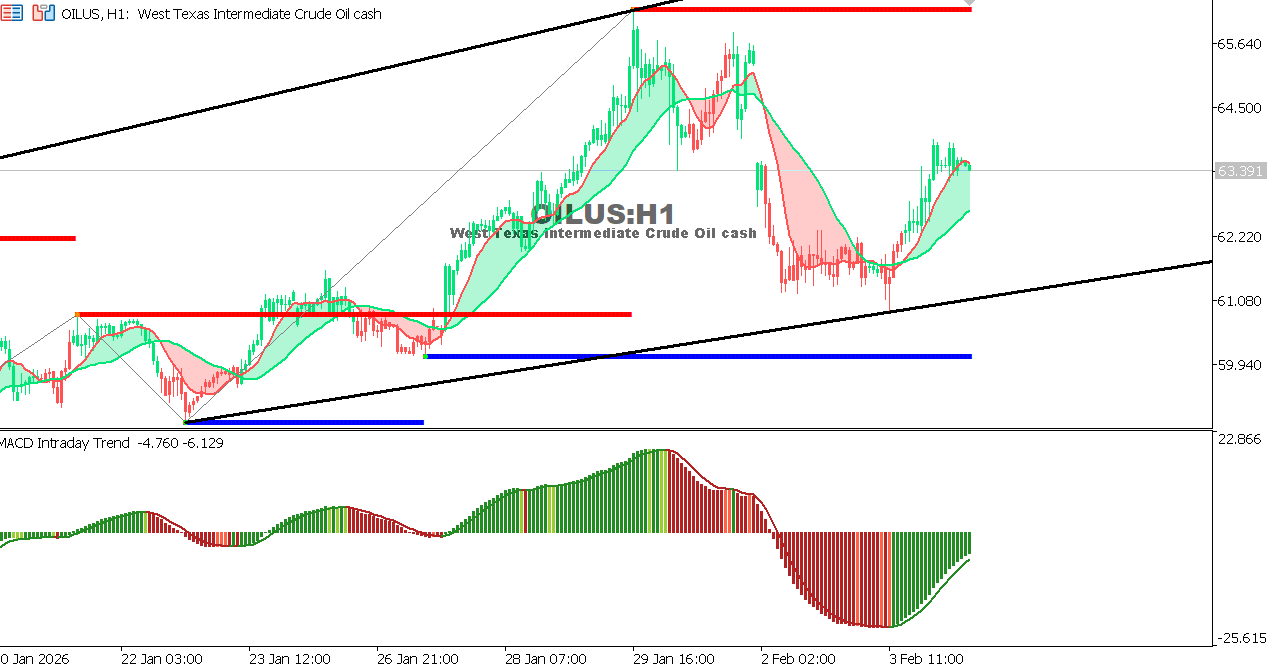 |
USOIL Chart on the hourly time frameOil is moving in a sideways range with an upward bias after bouncing from strong support levels, supported by a balance between economic concerns and stable demand. The price is holding above the short-term moving averages. General Trend: Neutral with an upward bias Expectation: A break above 64.20 could push prices towards 65.50, while a break below 62.10 would bring renewed pressure towards 61.30.
|
 |
|
|
 |
|
|