FXEM - EMPIRE MARKETS - Company New Article
To access the website's classic version and the new accounts, please click here
Feb 27, 2026
 |
|
|
 |
|
|
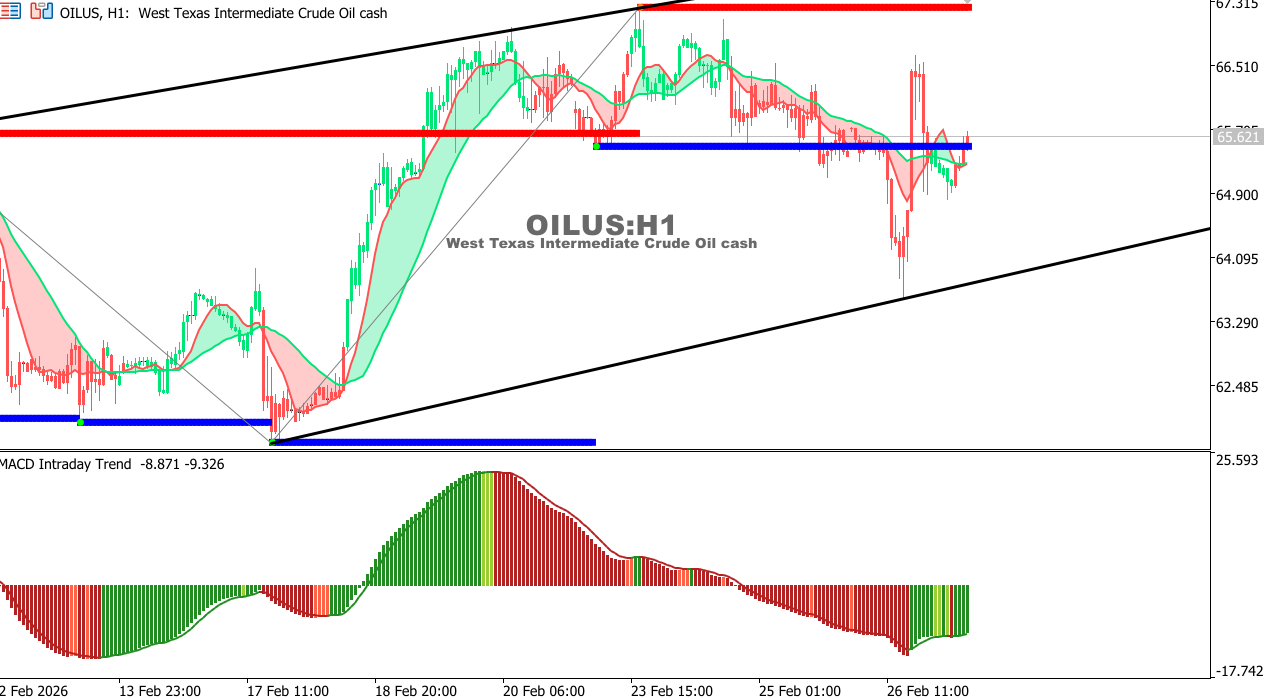 |
USOIL Chart on the hourly time frameOil is trading sideways following a recovery from the 63.80 area and is currently testing resistance at 66.20. Holding above short-term averages supports limited upside potential. The MACD is approaching the zero line, indicating a potential buildup for a stronger move. Overall Trend: Neutral Outlook: A break above 66.20 may push prices toward 67.10, while failure could return price to 64.80.
|
 |
|
|
 |
|
|