FXEM - EMPIRE MARKETS - Company New Article
To access the website's classic version and the new accounts, please click here
Feb 26, 2026
 |
|
|
 |
|
|
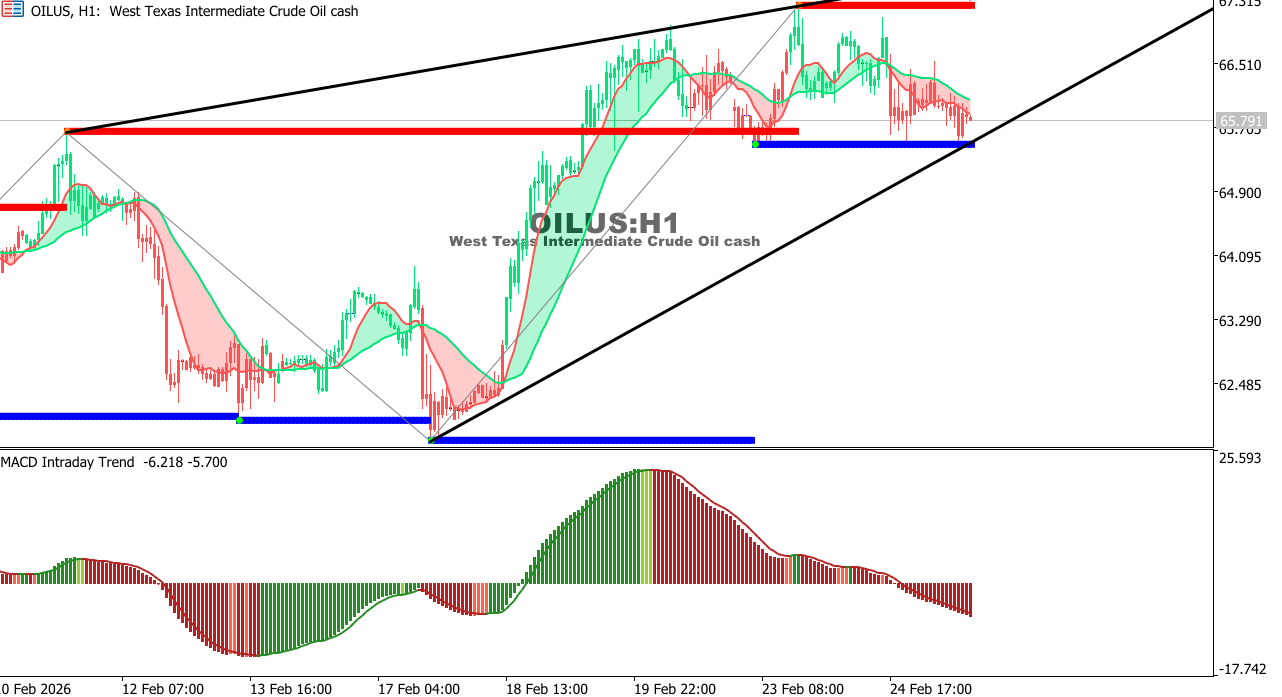 |
USOIL Chart on the hourly time frameOil is moving in a sideways-to-downward range around $66, with clear weakness in momentum. Holding below 67.00 keeps pressure on the $64.80 front, while a break above 67.20 could temporarily change the picture. Overall Trend: Sideways-to-Downward Expectation: Continued volatility with a slight downward bias.
|
 |
|
|
 |
|
|